Individuals with disabilities have great difficulties navigating and accessing essential services in cities. In this project, we use maps and digital storytelling to communicate to a broad audience the daily challenges and obstacles they face. We created immersive maps and 3D scenes to tell the story of three people we interviewed, all electrical wheelchair users. One of them is from the city of Bogota, Colombia; the other two live in the city of Munich, Germany.
A tale of two cities: wheelchair mobility in Bogota & Munich
"A story-based mapping project that shows how people in wheelchairs experience the cities of Bogota and Munich."

Sneak peek of "A tale of two cities".
What it is about
How we built it
We required a diverse toolbox to complete the project. We learned and employed social research methods to conduct interviews; we applied semi structured questionnaires to the people we contacted and based our approach on the theory of social cartography [1]. We processed and displayed our data using GIS software, namely, ArcGIS Pro. We used the ArcGIS Storymaps interface to show our results and included sounds in our visual essay.
Challenges we ran into
Our main challenge was to organize the data and insights into a coherent and organized audiovisual essay keeping it as short and readable as possible. Even though we are satisfied with our result, we still found there are trade-offs when trying to connect and compare the stories of different people; some finer details will be lost in the process.
What we're proud of
The highlight of our project is the 3D animated models showing the paths of our interviewees. We employed the model meaningfully, and we were able to transmit many aspects of the experiences of our participants through them in an innovative way.
What we learned
We learned how to obtain data from people via interviews and turn this information into a map. We also gained more proficiency with GIS software. Finally, our abilities as storytellers, as we structured and put together a compelling narrative, were also improved.
What's next
We would like to have more flexibility in the layout of our page; for that, we would need to run the open-source Storymap code locally to adapt it more to our needs. We would need to train our web-developing skills to achieve this.
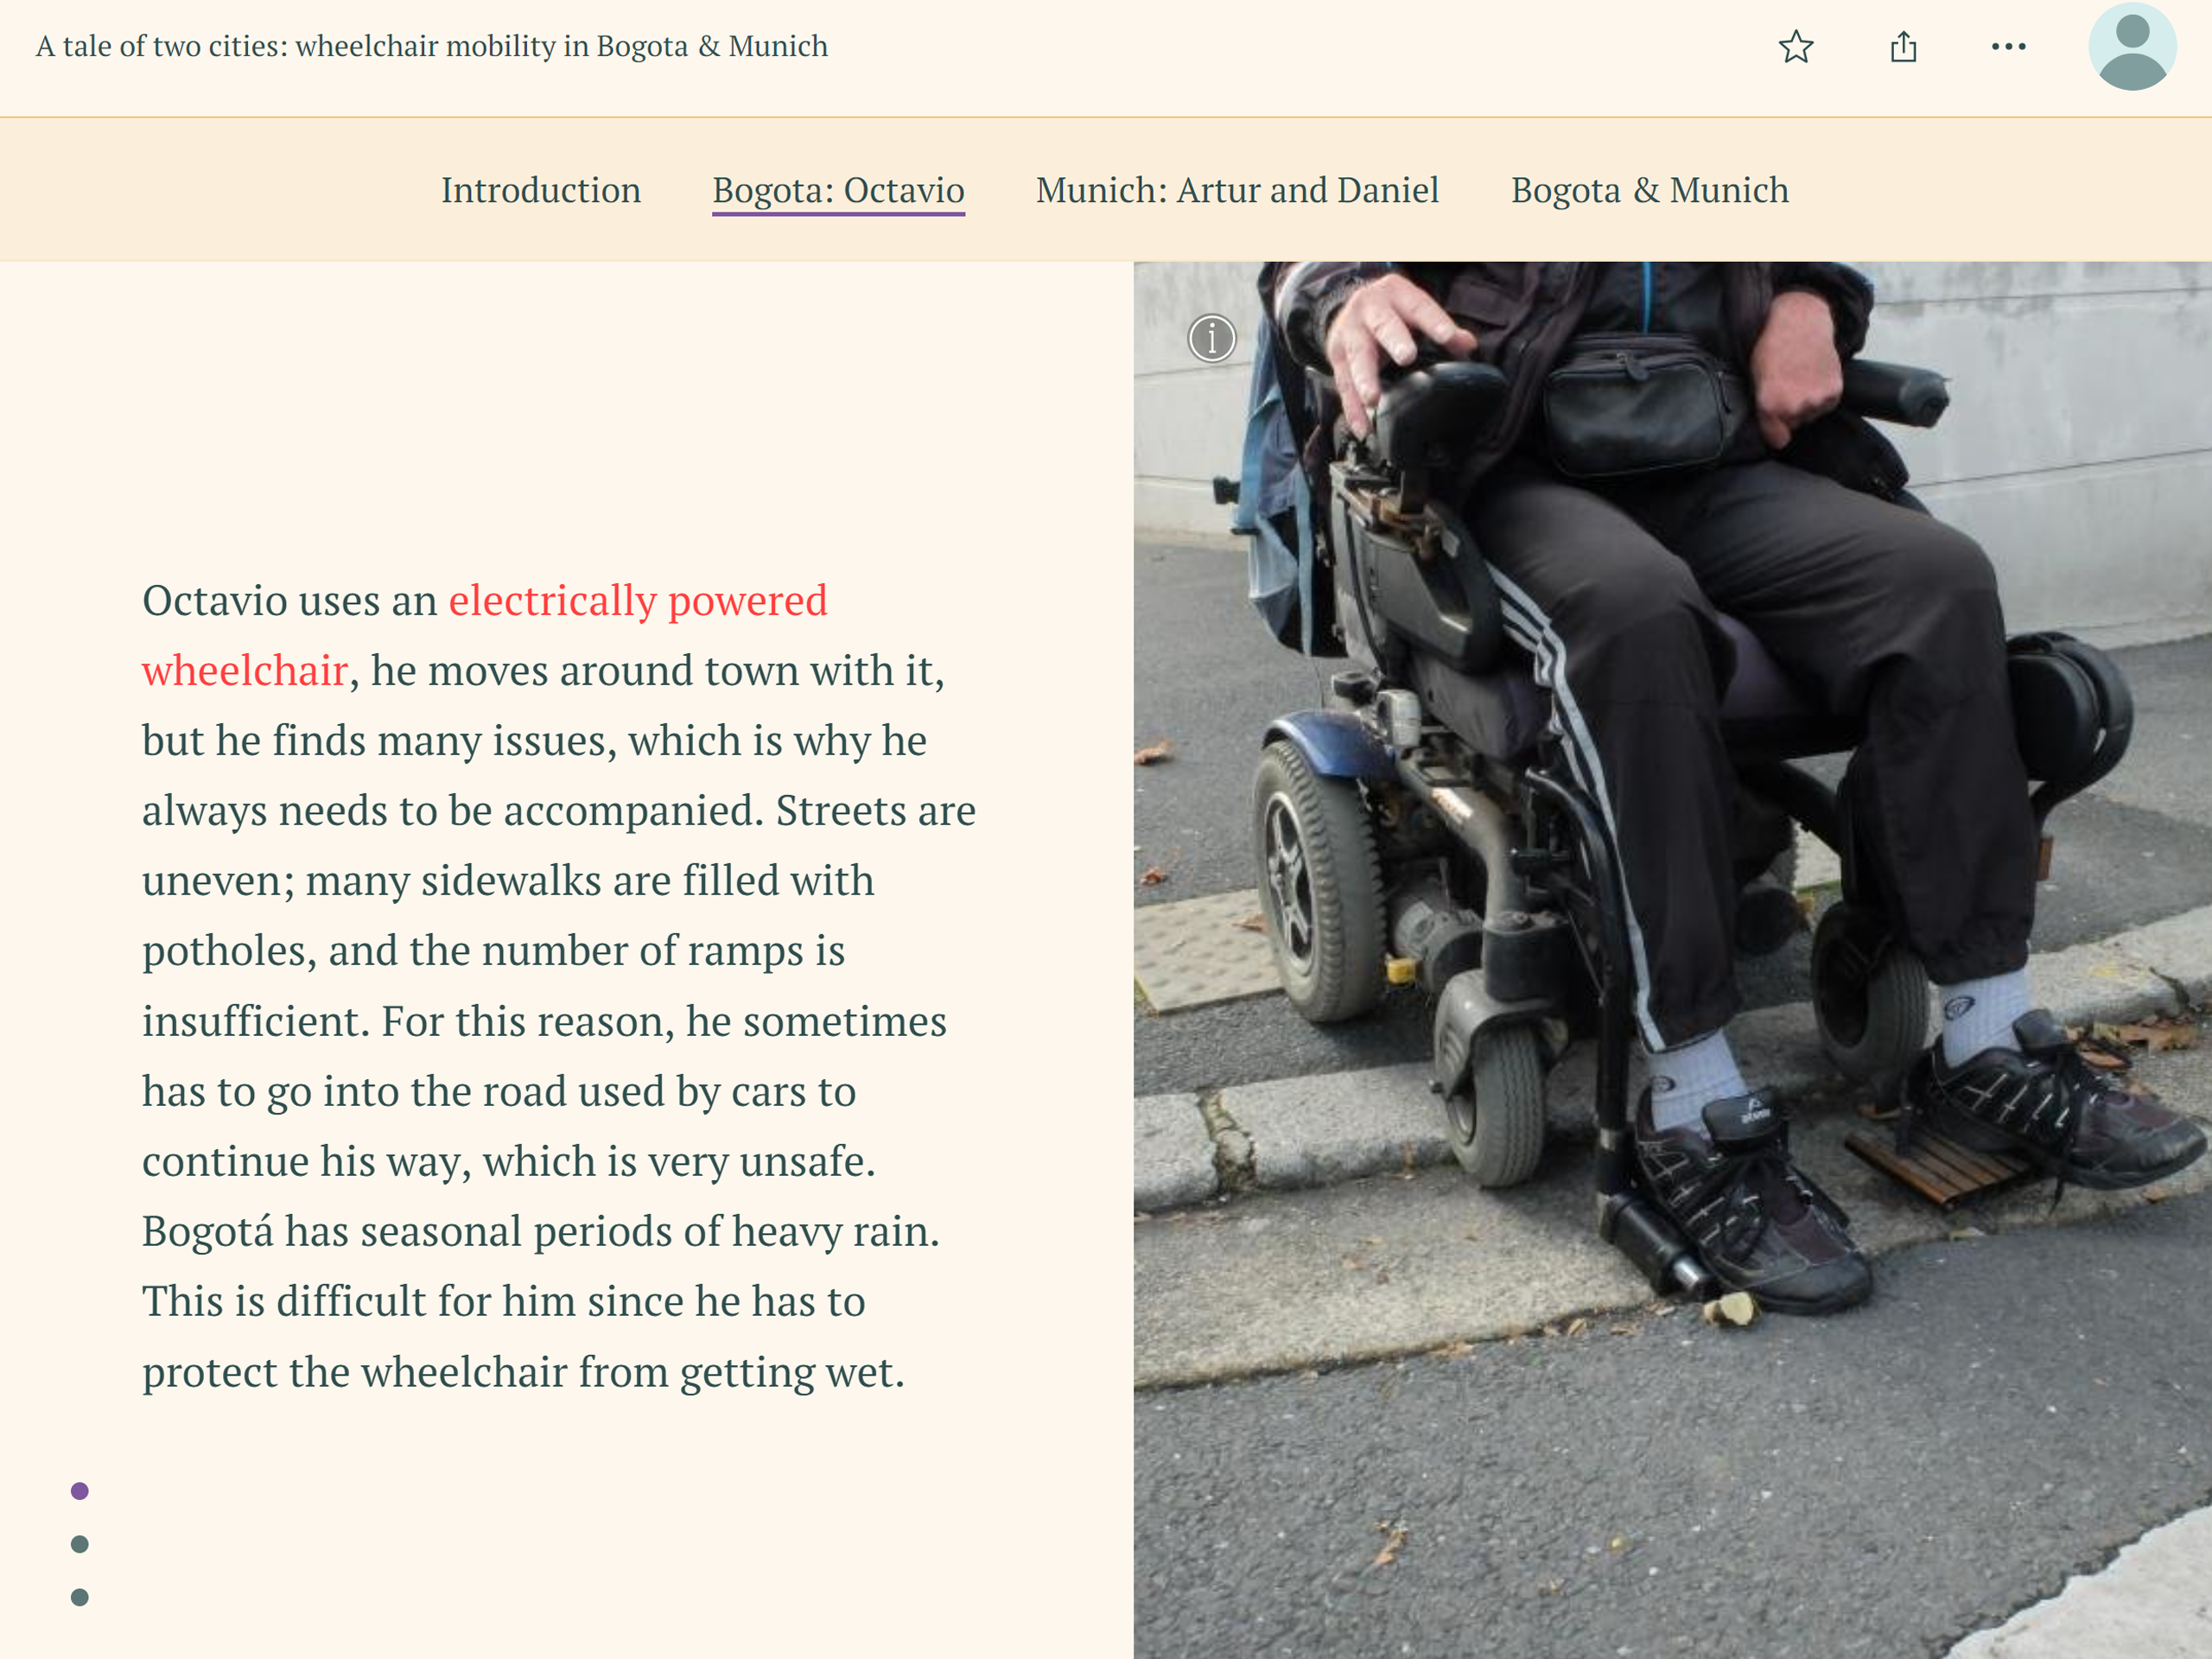
We used colors and pictures to tell the story.

Map of Bogota.

Munich 3D scene with snow animation.
Sources
[1] Barragán-León, Andrea Natalia. “Cartografía Social: Lenguaje Creativo Para La Investigación Cualitativa.” Sociedad y Economía 36 (April 2019): 139–59. https://doi.org/10.25100/sye.v0i36.7457.
Students
Nicolás Martínez Heredia
Viktor Kochkin
Viktor Kochkin
12th intake
Supervisor
Juliane Cron, M.Sc.
Keywords
Storymap, storytelling, experience, wheelchair, urban, city
Try it