Making a mark against period poverty
"Shedding light on where and how countries are actively making a mark."
What it is about
In a world where nearly half the population experiences menstruation, access to menstrual hygiene products is critical for reproductive health, dignity, and gender equality. However, millions face period poverty due to financial constraints, geographic restrictions, and cultural stigma. The goal of this project is to raise awareness about the current extent of period poverty and assess government engagement in addressing this issue. The interactive map is a tool for people to find countries that are making the ‘biggest mark’ against period poverty. Further, the resource container provides links and resources for people to refer to and get actively engaged. By finding where and how people are fighting period poverty we hope to inspire and support others who want to do the same!
How we built it
We wanted to show what the current extent of period poverty is and what is being done to fight it on governmental levels. In the first step, we collected data on our topic through online searches as well as a short online survey asking people to contribute resources about their home countries. Following that we decided to focus on the four most comprehensive datasets, setting up a collection of data in Excel. For project planning, map design and setup of the interactive map prototype we decided to use the design app Figma. Vector files of each country in a Natural Earth projection were obtained using ArcGIS.
Challenges we ran into
Our biggest challenge for this project was the amount of time required to collect data due to period poverty data being inconsistent and scarce. Hence, we had to learn how to make tough decisions on data selection and how to deal with missing information. Another challenge was the limitations of Figma in creating interactive maps. We intentionally decided to use Figma for this project to experiment with it and discover the capabilities of using a user interface tool for cartographic purposes. Despite it working very well for our goal, we realized that the scope of our map combined with Figma not having a lot of automation for applying datasets to our components posed a challenge. This meant we had to limit by the number of countries that could be prototyped within the allotted time.
What we're proud of
What we are most proud of is how we used every challenge as an opportunity to be flexible in our way of thinking and to keep researching the best way to implement our project vision. Additionally, both of us come from very different academic backgrounds which enabled us to learn a lot from each other. Finally, we created a tool that can inform the world and empower others which is exactly what mapping should be.
What we learned
These adaptions allowed us to try and implement various cartographic design principles and taught us how to keep a flexible mindset. Despite all the changes our project went through, we found a comprehensive way to implement a map using an unusual mapping tool as well as an innovative design to depict data through the mark.
What's next
In the future, we would like to prototype every country as well as implement our prototype as a functioning web map and interactive collaboration platform. Further, we believe that our prototyped concept could easily be adapted for other topics in social action and research.
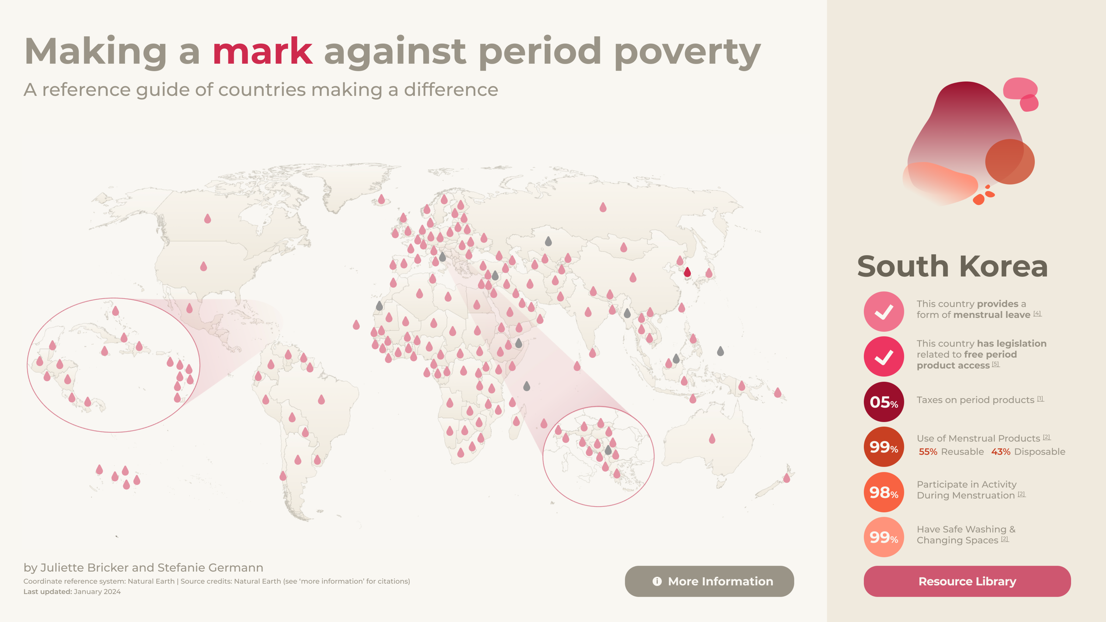
A screenshot of our main page with a map on the left side with pink resp. grey drops indicating countries where data on period poverty is available respectively not available. When clicking a pink drop the corresponding country information sheet will appear on the right side.
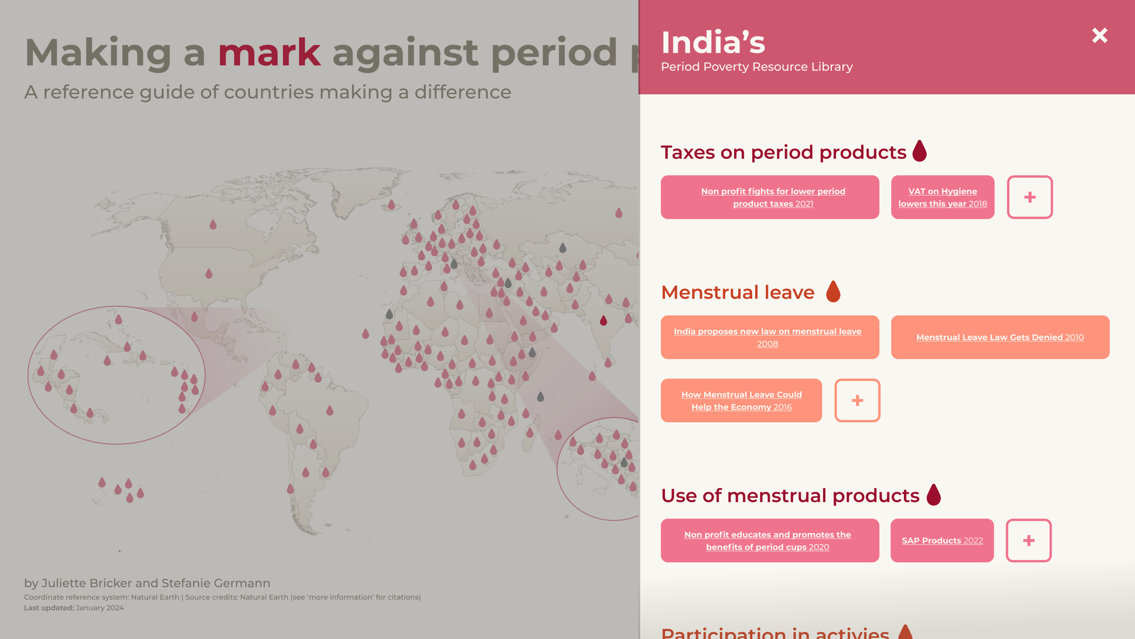
When clicking “Resource Library” this panel will appear showing gathered resources on different aspects of period poverty. There is also the possibility for individuals to add resources by clicking the “+” button.
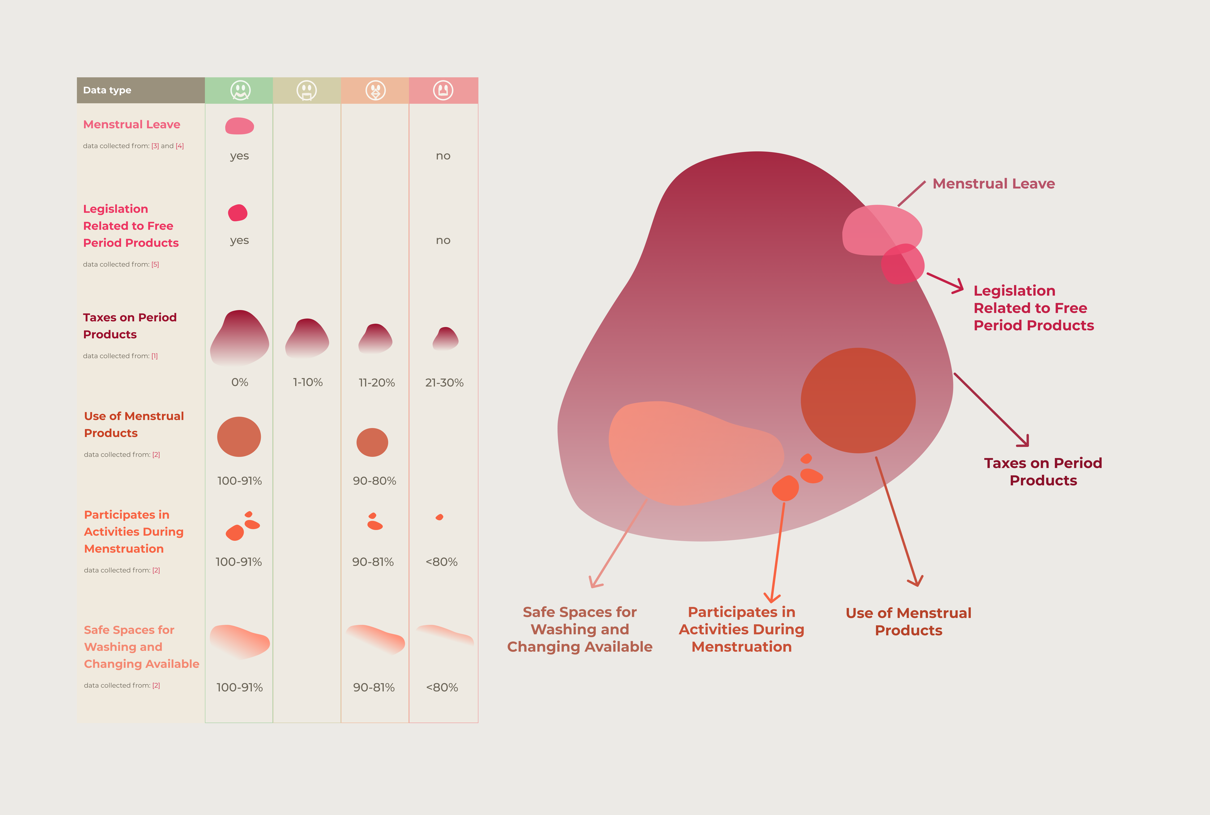
The “mark” allows to quickly identify countries which make the biggest impact in the fight against period poverty.
Students
Juliette Bricker
Stefanie Germann
Stefanie Germann
13th intake
Supervisor
Juliane Cron, M.Sc.
Keywords
Making a mark, period poverty, menstruation, collaborative map, social action, data visualization
Try it