Emotions are an essential part of a person's life and mental well-being. Sometimes, it is difficult for a person, especially if unfamiliar with the city, to find places where they can experience certain emotions or, on the contrary, to identify places associated with triggering emotions. The main aim of our map is to help people solve this problem by developing a guide for emotional navigation in the city. In addition, the map can be interesting for people familiar with Munich as an overview of the emotional side of different places. In this project, we considered six basic emotions: happiness, sadness, surprise, disgust, anger, and fear.
Emotion Map: a guide to your well-being
"Do you want to explore Munich emotionally? Try our map!"
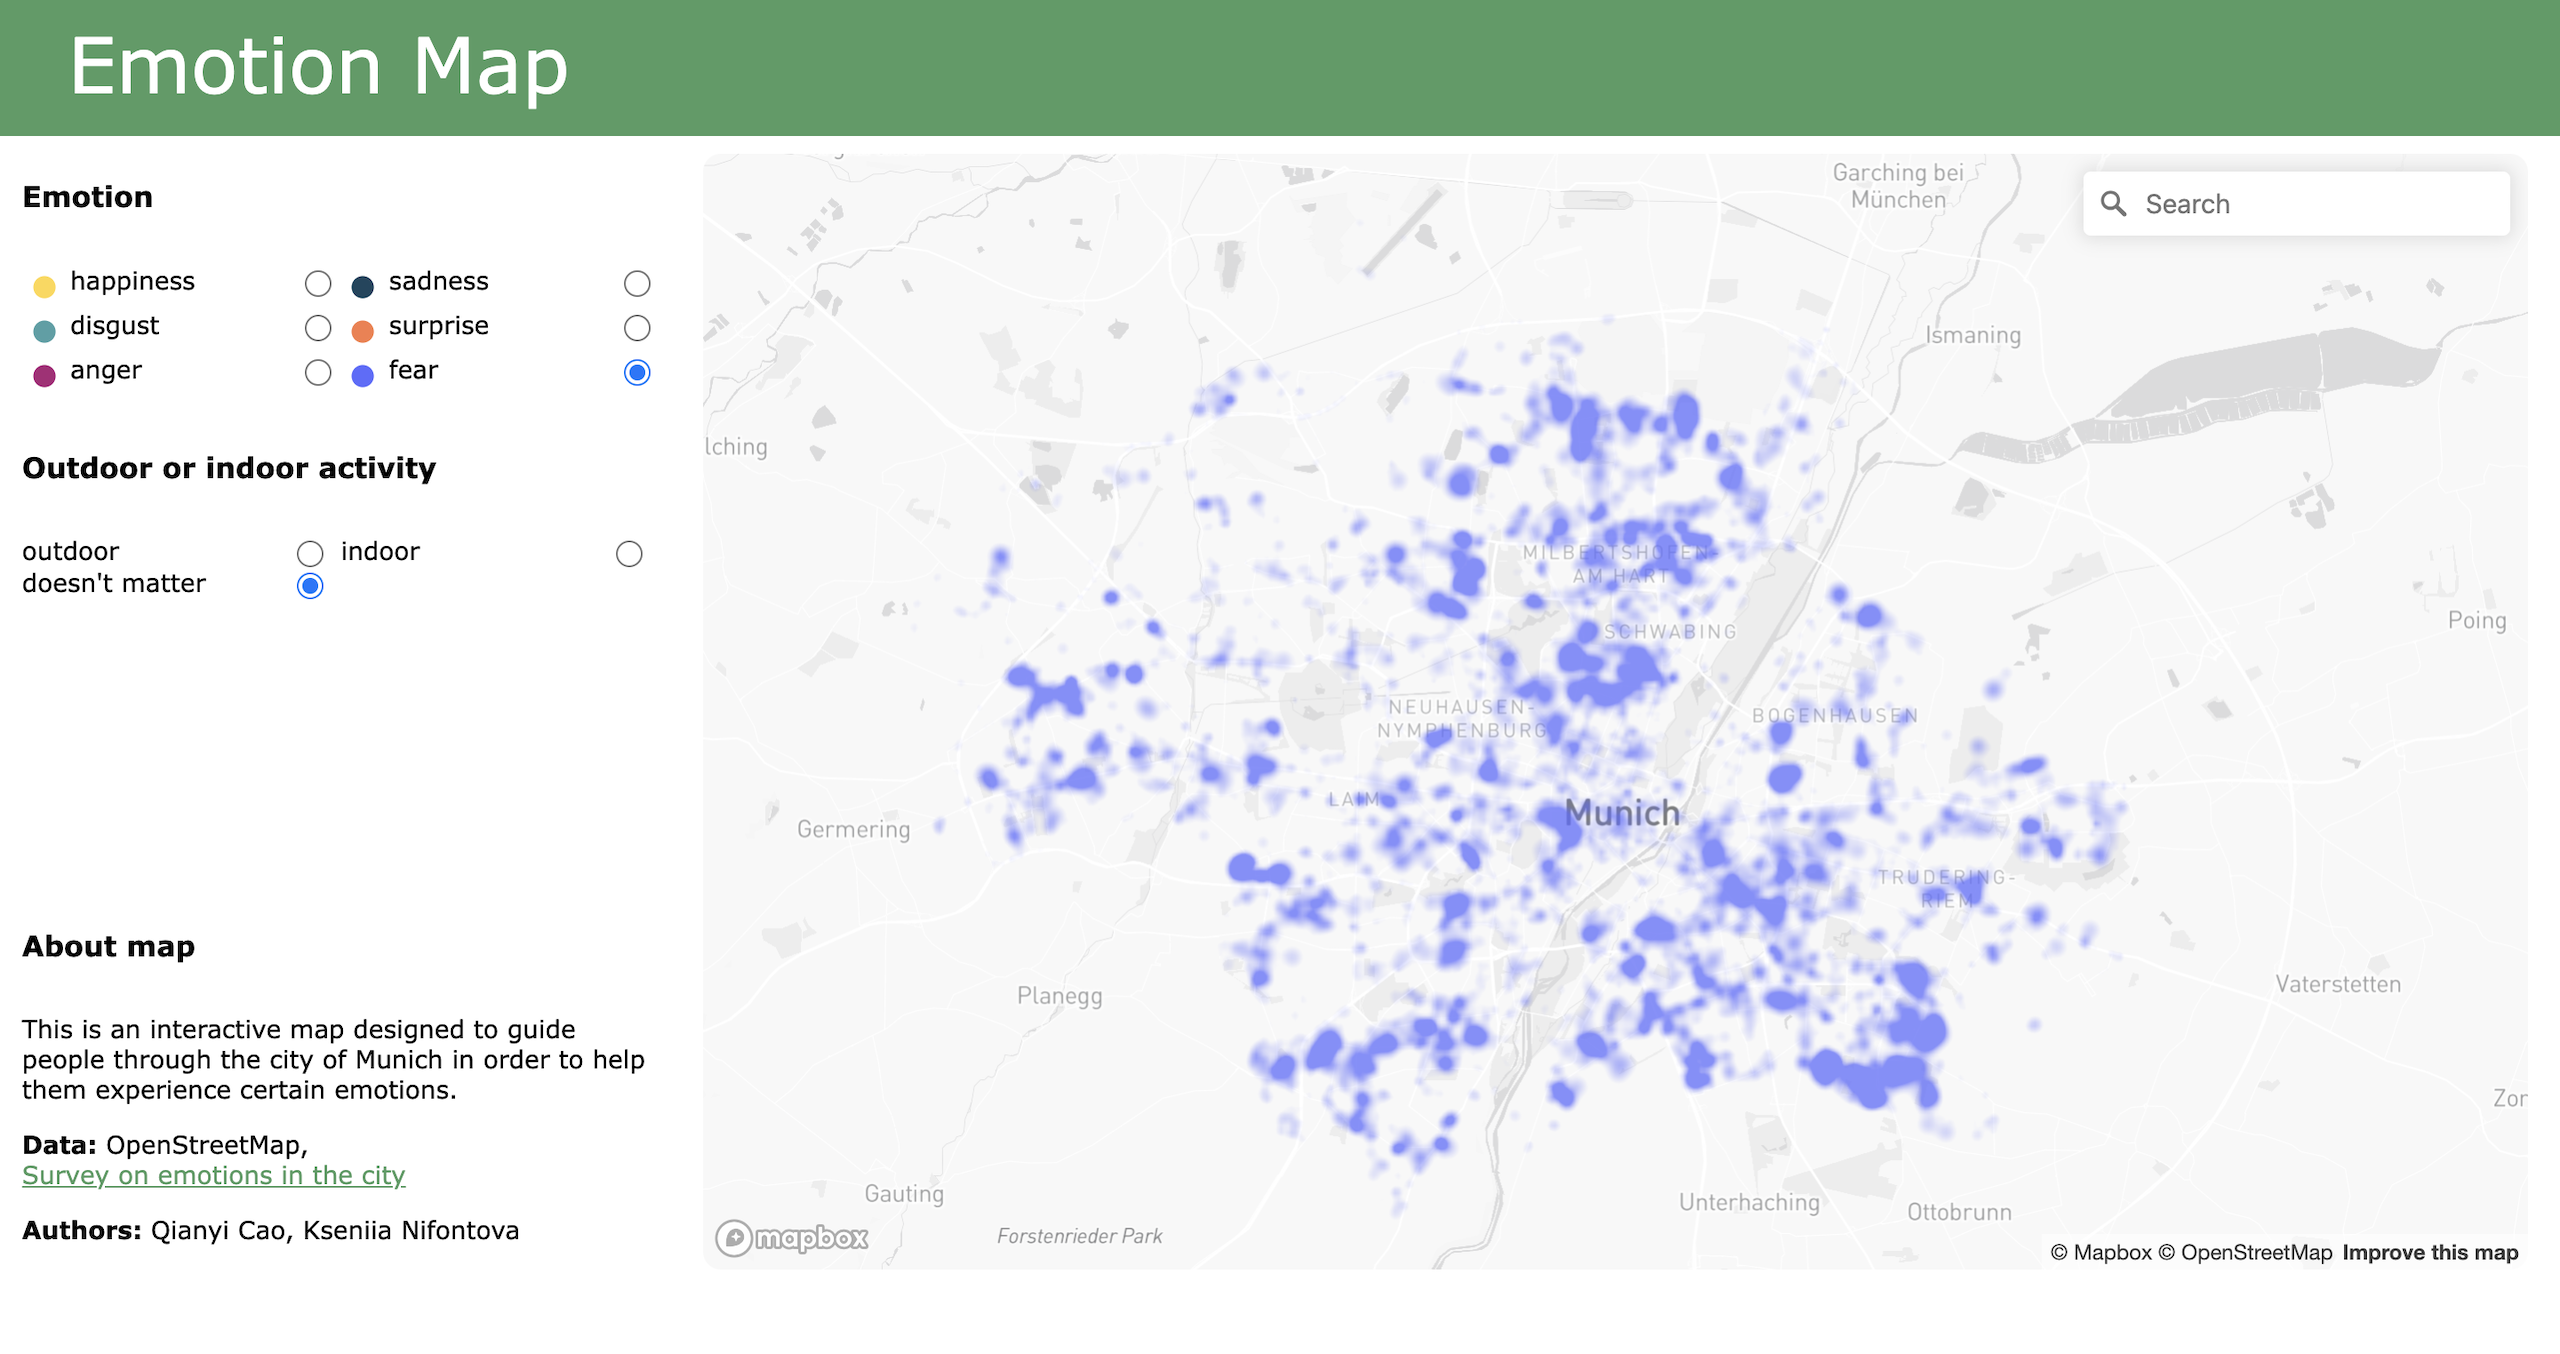
Overview of our Emotion Map.
What it is about
How we built it
Intending to visualise the emotions of places, we collected freely available and high-quality spatial datasets from OpenStreetMap. We classified the shapefiles of places in Munich, and to avoid layer overlaps, we used ArcGIS Pro to convert all polygons and polylines to point features. We designed a survey with closed and several open-ended questions using Google Forms to assess how different characteristics of places relate to our six emotions. There were 28 valid responses, and the percentage of votes was used as the weight of the characteristic for the emotions. To link the emotions to the places, we manually defined the general characteristics of each category of place. Then, it was convenient to calculate the weight of emotions for places after joining the survey results and the attribute table of place layers with ArcGIS Pro. The interactive map was created using HTML, CSS, and JavaScript, actively using the Mapbox GL JS library.
Challenges we ran into
Emotions are subjective and vary among individuals and over time. Linking abstract emotions to physical places is challenging due to limited existing research. We had difficulties in designing the survey, receiving just 28 valid responses. Creating an interactive map also had challenges, from layout selection to writing JS functions from scratch. In addition, unintentionally, the appearance of the map varies across browsers, so we recommend using Google Chrome.
What we're proud of
Mapping mental emotions is challenging; we created a whole new algorithm to calculate the relevance between emotions and places. We're also proud that we were able to build the whole map from scratch and create 2 JS filters, which was a completely new task for us.
What we learned
While processing the spatial datasets in ArcGIS Pro, we explored many practical tools and methods with this powerful application. We also discovered many things about web map development, such as how many CSS layouts exist (and how hard it is to create a responsive design layout) and how many powerful functions Mapbox JS GL has (and how hard it is to combine them across different functions).
What's next
We experimented with mapping the emotions of places based on our survey. For further development, expanding the survey audience to get more responses and automating the analysis of survey results and spatial data processing would be excellent. We also want to improve the map design, optimise the code to work better with different browsers, try other visualisations to make the map more user-friendly, and improve the process of colour selection to better represent specific emotions [1].
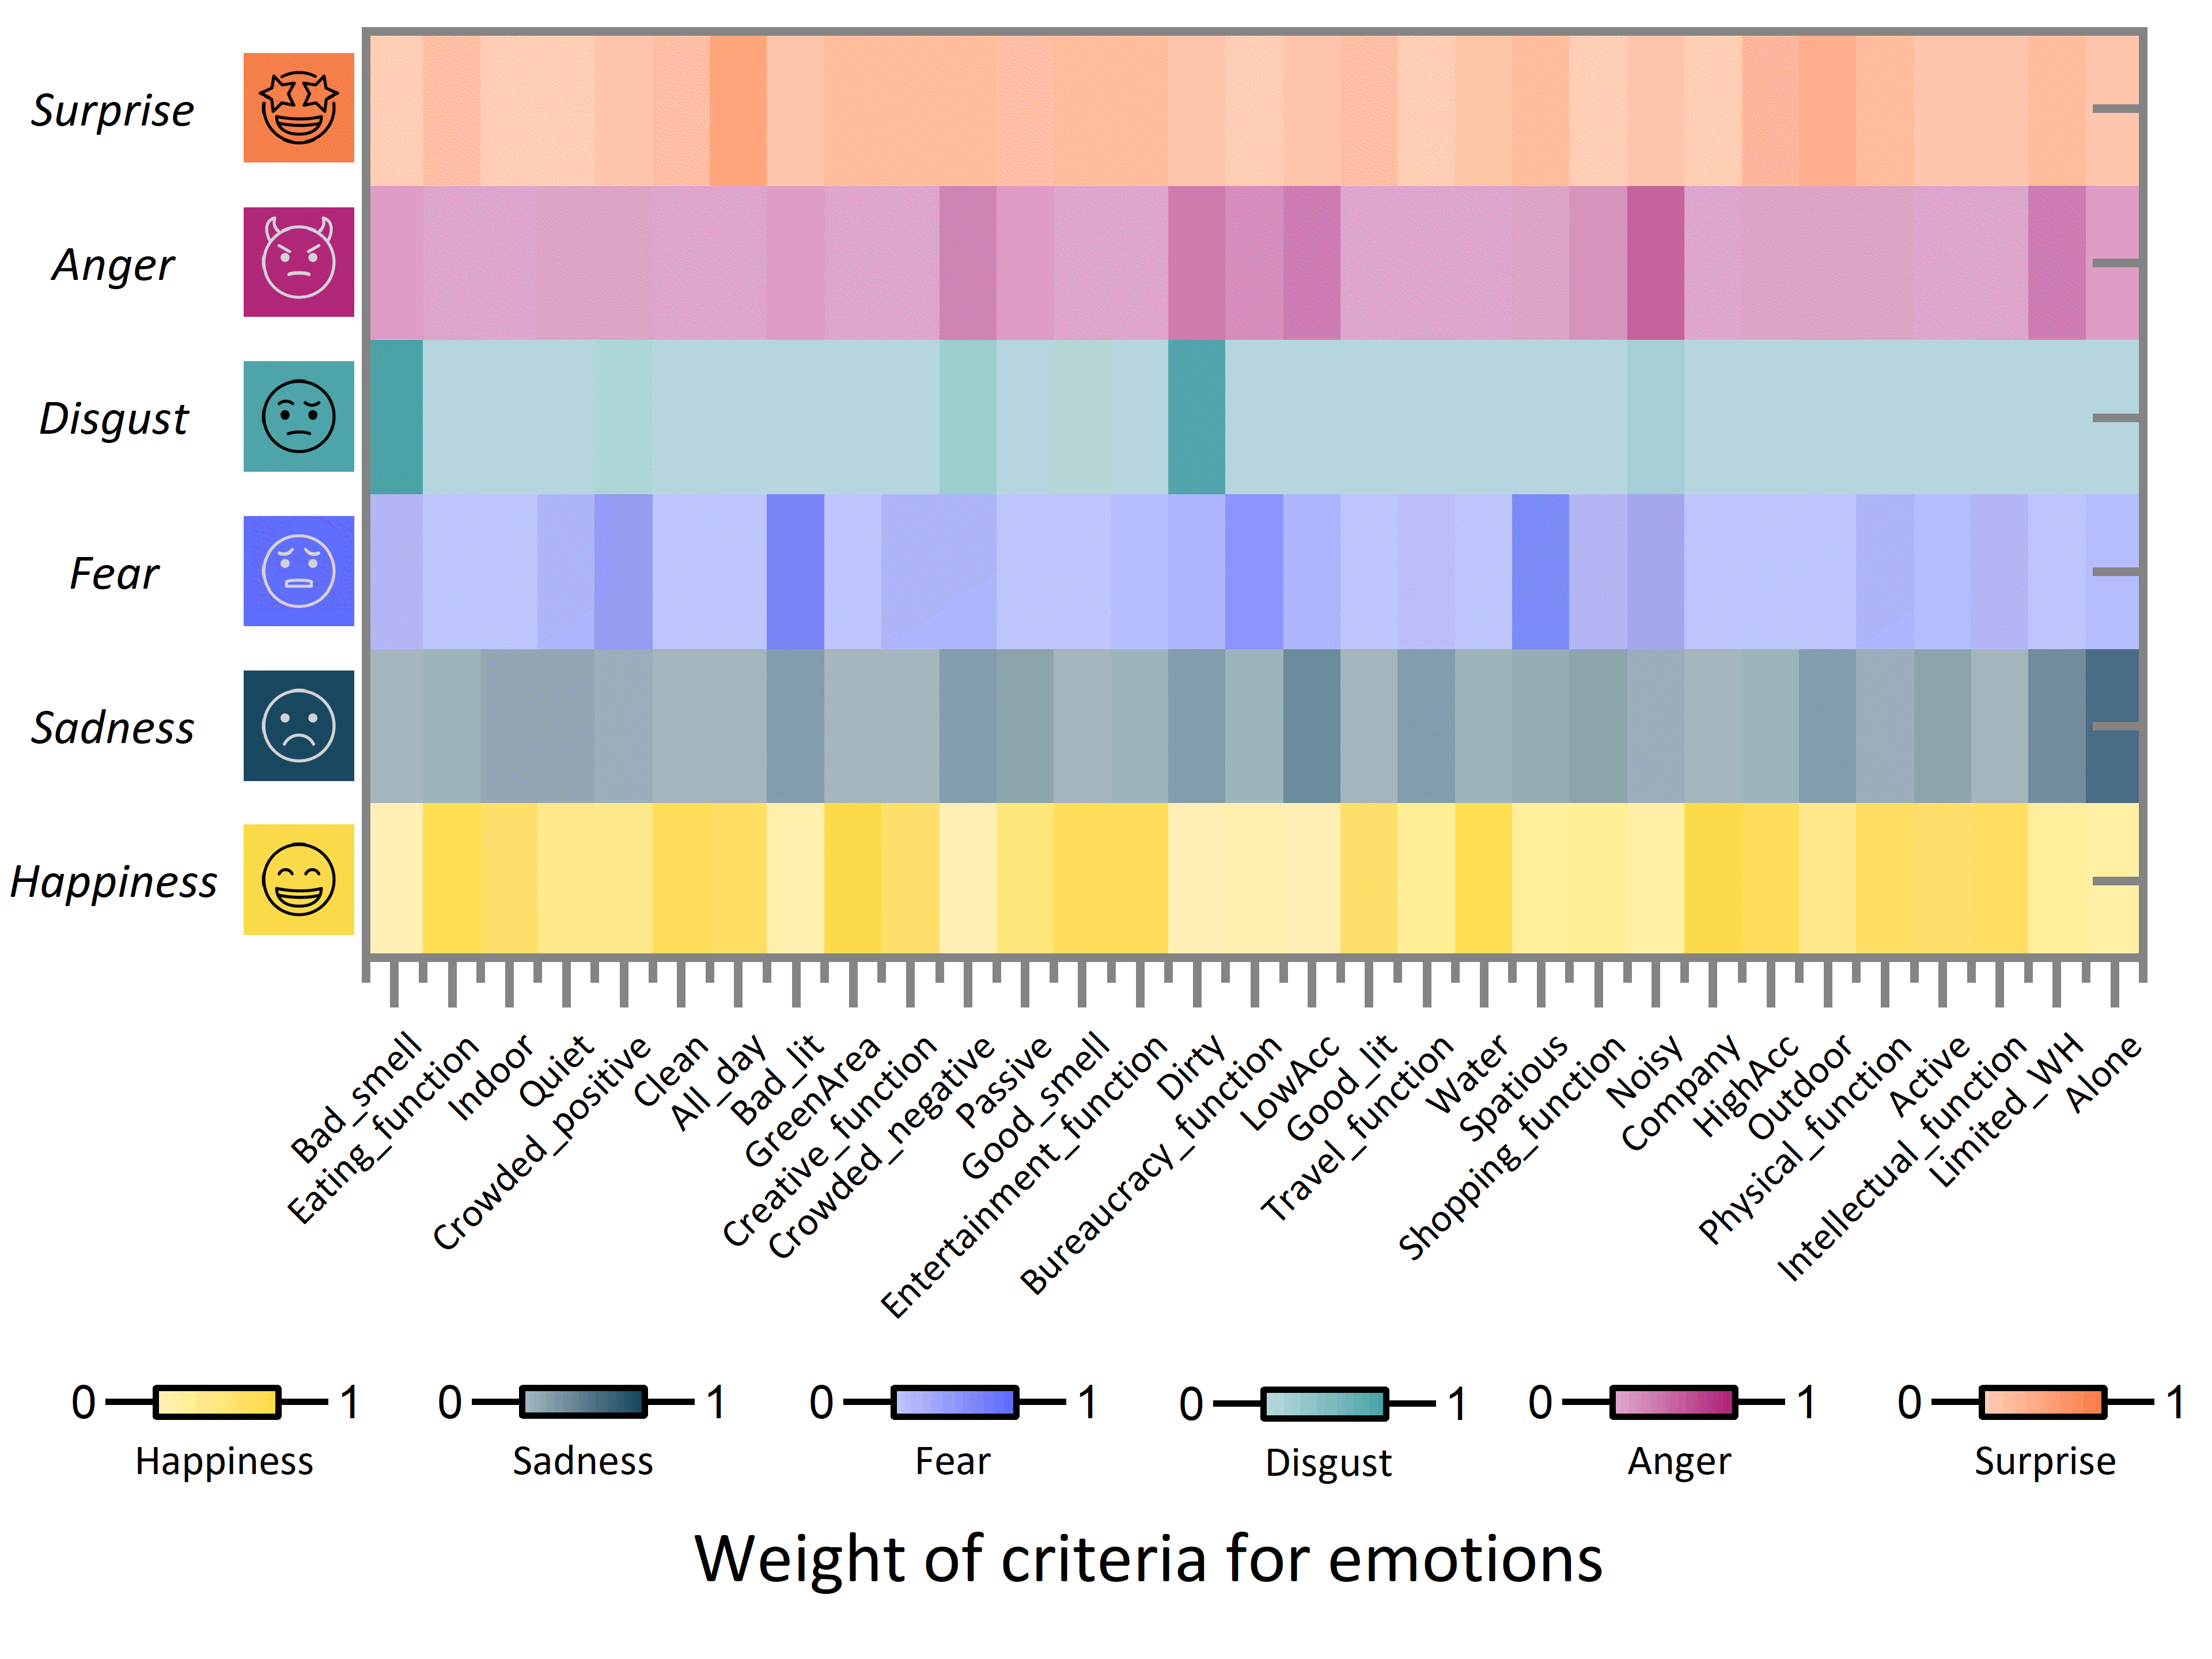
Survey results, weights of 31 criteria for six emotions.
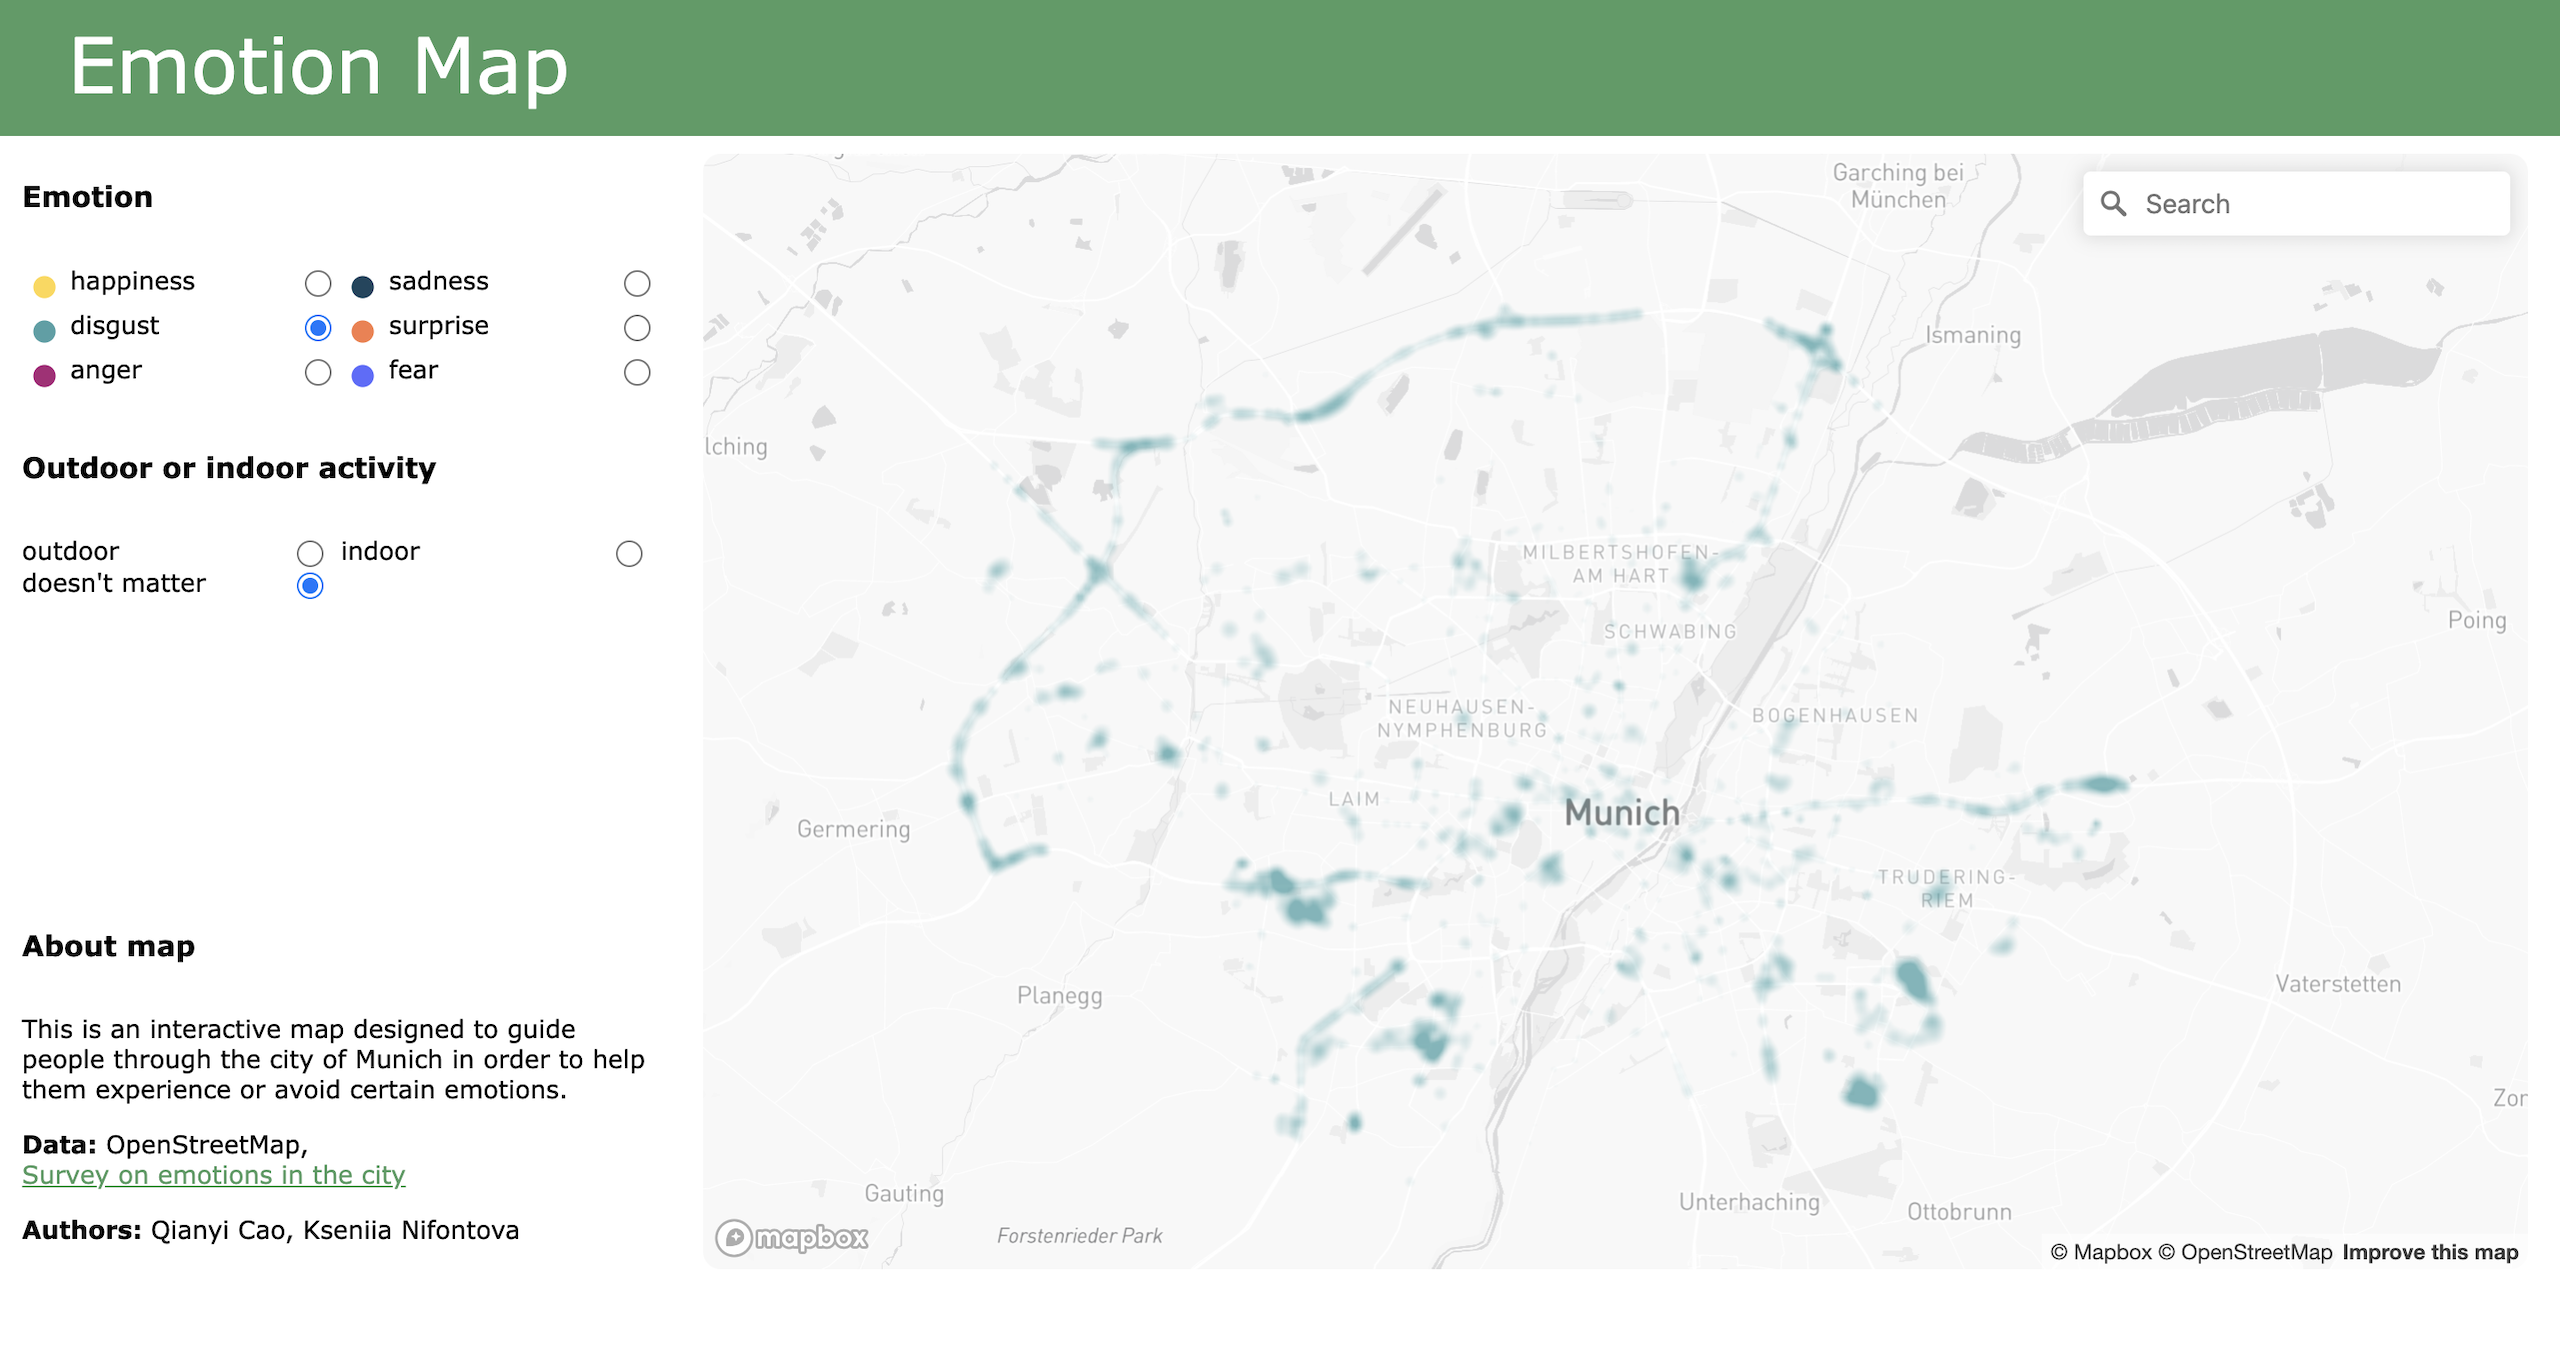
Map in "disgust" emotion mode, the distribution of places is different from other emotions, major roads are highlighted.
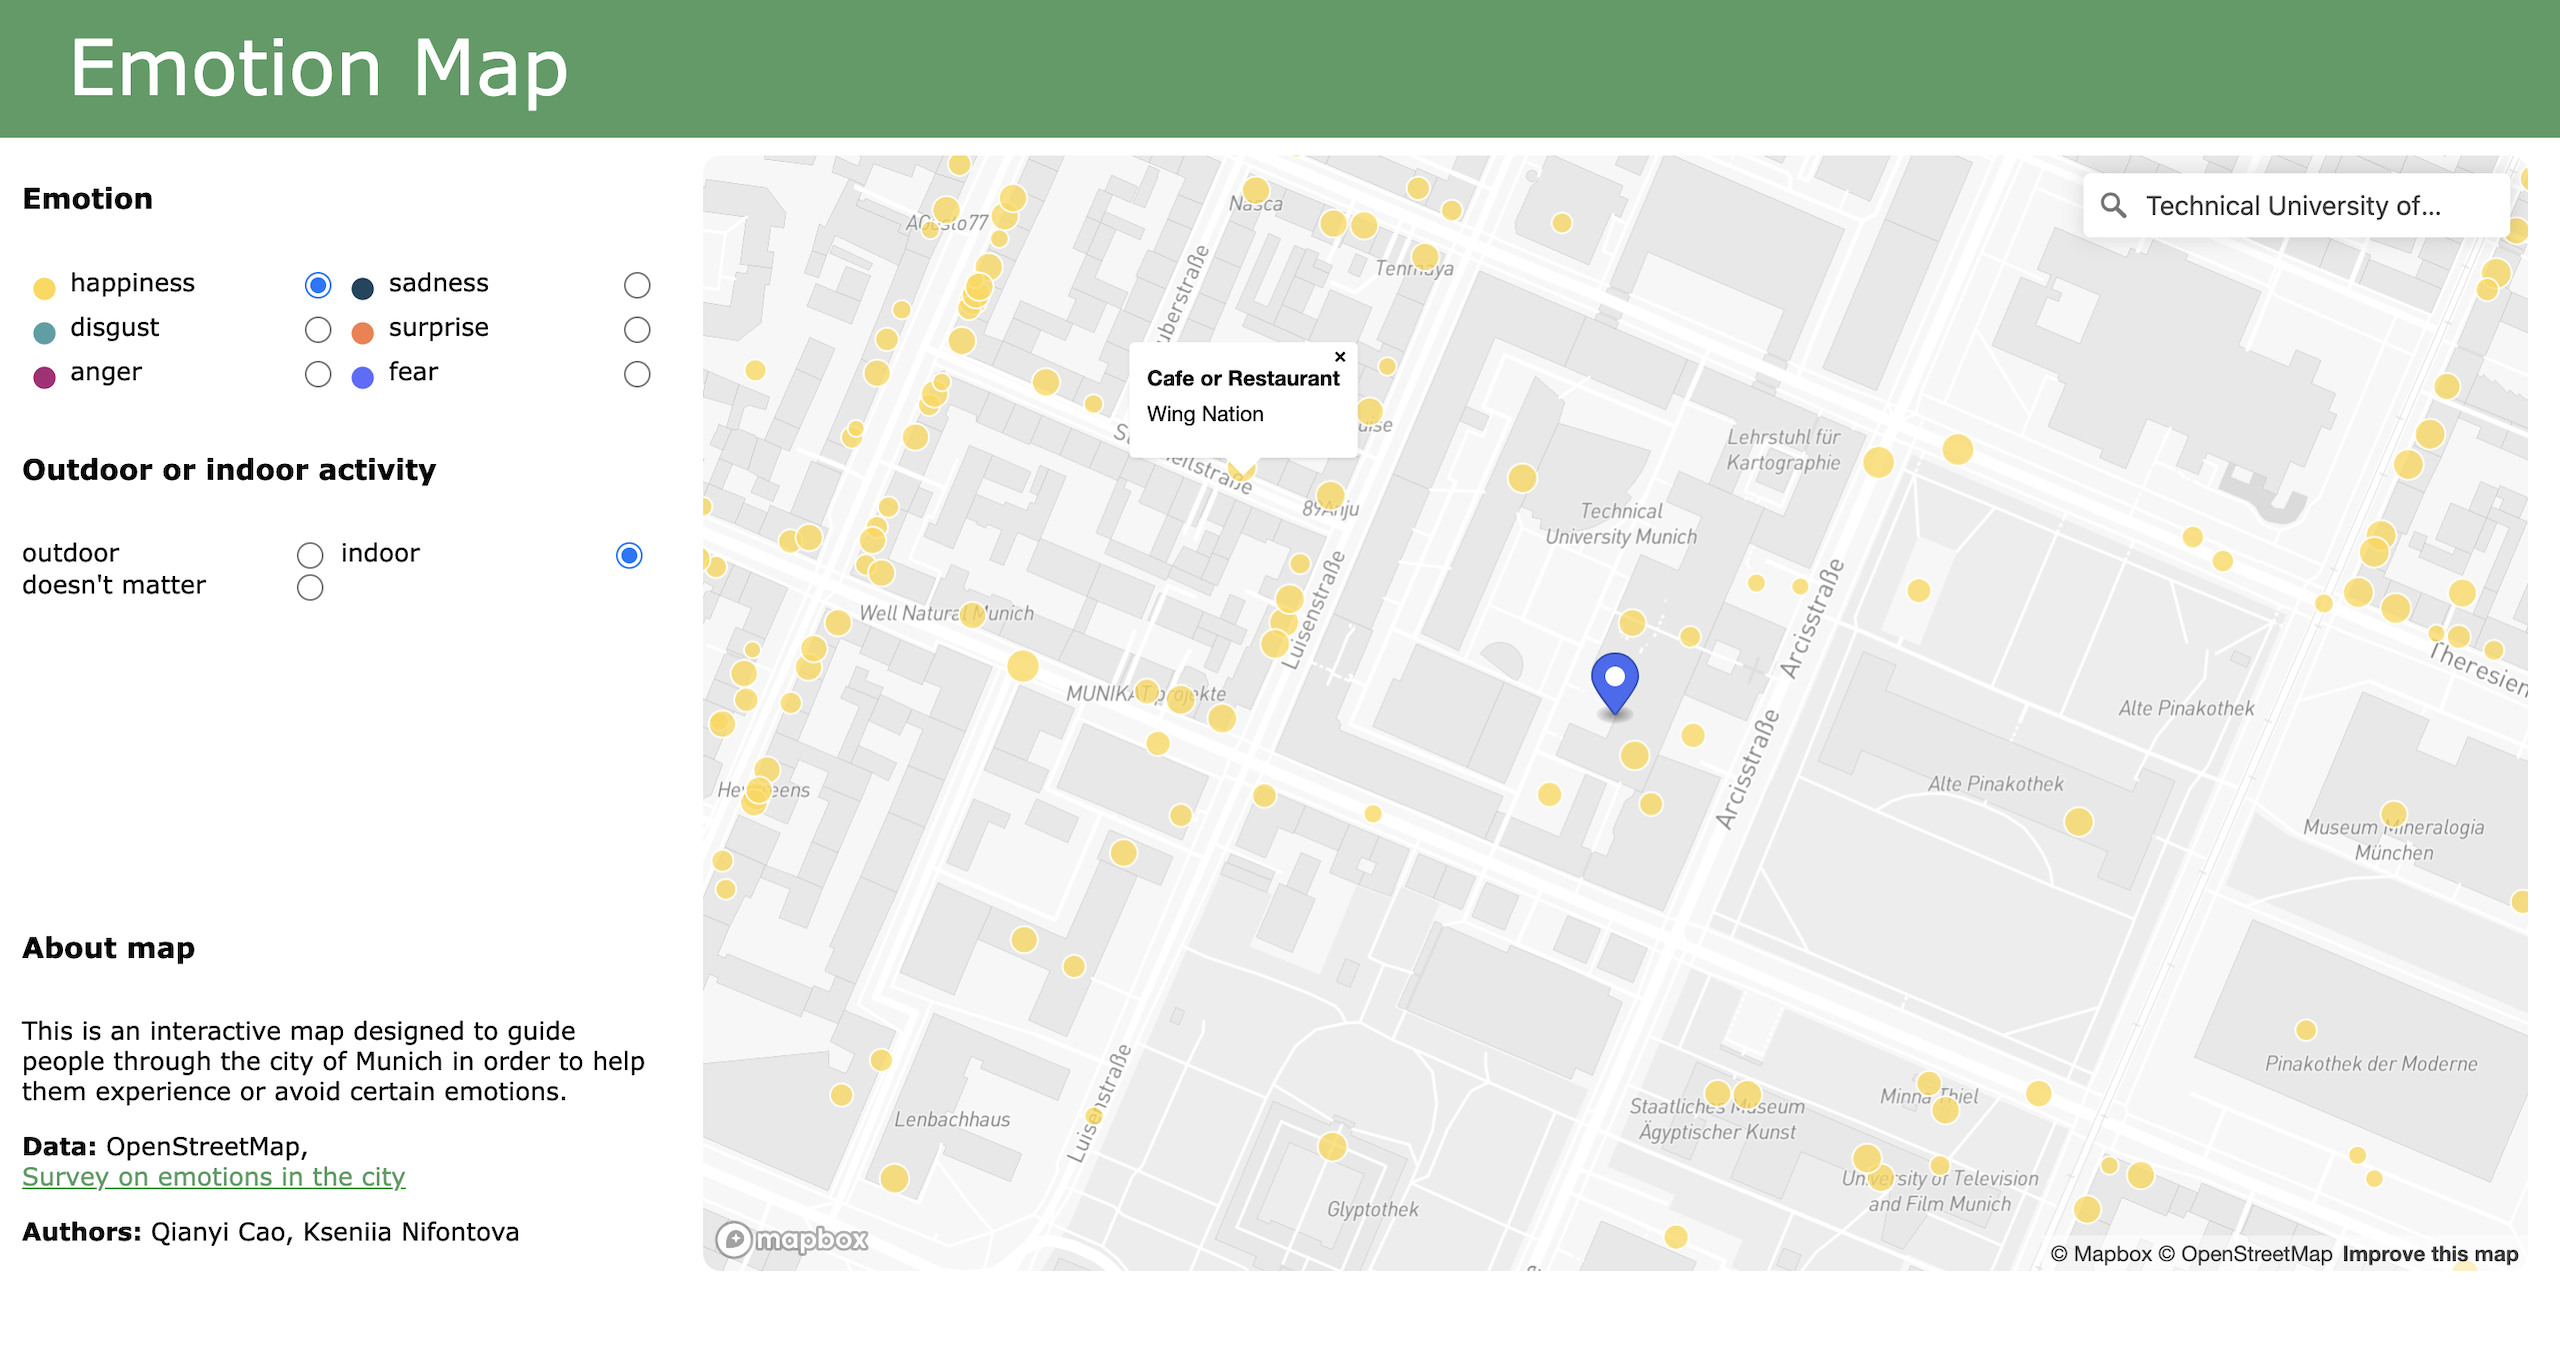
Map on a larger scale, round symbols of different sizes show places that people associate with happiness, focus on TUM.
Sources
[1] Kushkin, A., Giordano, A., Griffin, A., & Savelyev, A. (2023). Cognitively Congruent Color Palettes for Mapping Spatial Emotional Data. Matching Colors to Emotions. Cartographic Perspectives. https://doi.org/10.14714/CP102.1821
Students
Qianyi Cao
Kseniia Nifontova
Kseniia Nifontova
13th intake
Supervisor
Juliane Cron, M.Sc.
Keywords
Emotions, interactive map, emotional evaluation of places, Munich
Try it