Life in Rubber Boots – Projecting the Effects of Global Warming on Sea Level Rise (SLR) by the year 2100
“An interactive story on one of the effects of Global Warming.”
What it is about
According to the IPCC report of 2019, the sea level will rise between 0,26 m and 1,1 m until the year 2100 because of Global Warming [1]. We wanted to create a StoryMap that is available to everyone and has interactive options to educate people about Sea Level Rise (SLR), by calculating and visualizing how far inland the water would rise in both extreme value scenarios. Our aim was to increase awareness about the inevitable coming floodings that will happen across the world and will affect many lives.
How we built it
To execute the project and therefore visualize the two different scenarios of SLR, 0,26 m and 1,1 m, on all continents several steps had to be taken. We first needed DEM’s and shorelines of the whole world. Then, we calculated the submerged areas in ArcGIS and further pre-processed them with the help of several Geoprocessing Tools, such as Raster Calculator. Next was the selection of only the as flooded marked polygons that are connected to the shoreline, because only those would be inundated in real life. Finally, we calculated the flooded km2 for every continent, visualized those numbers and created our interactive StoryMap.
Challenges we ran into
Challenges occurred mainly in the data collection, as neither one of us had any experience with working on such a big global level and therefore did not know where to find it. Also, not being familiar with all the pre-processing steps took us of a lot of time to overcome.
What we're proud of
We are more than proud of the fact that we finished this exciting project on time, even though we were not always positive on this. Also, we believe that we have contributed to a significant scientific issue and are happy that we can inform and educate people with our work.
What we learned
We learned how to find, access, and deal with big datasets on a global scale, how to pre-process them for our needs and wishes, and how to visualize the results in an attractive and understandable way.
What's next
Further work will be devoted to find out how many people live in the calculated flooded areas now and in the year 2100. We also want to know in which aspects live will be most influenced by it and to which areas the most attention should go to.
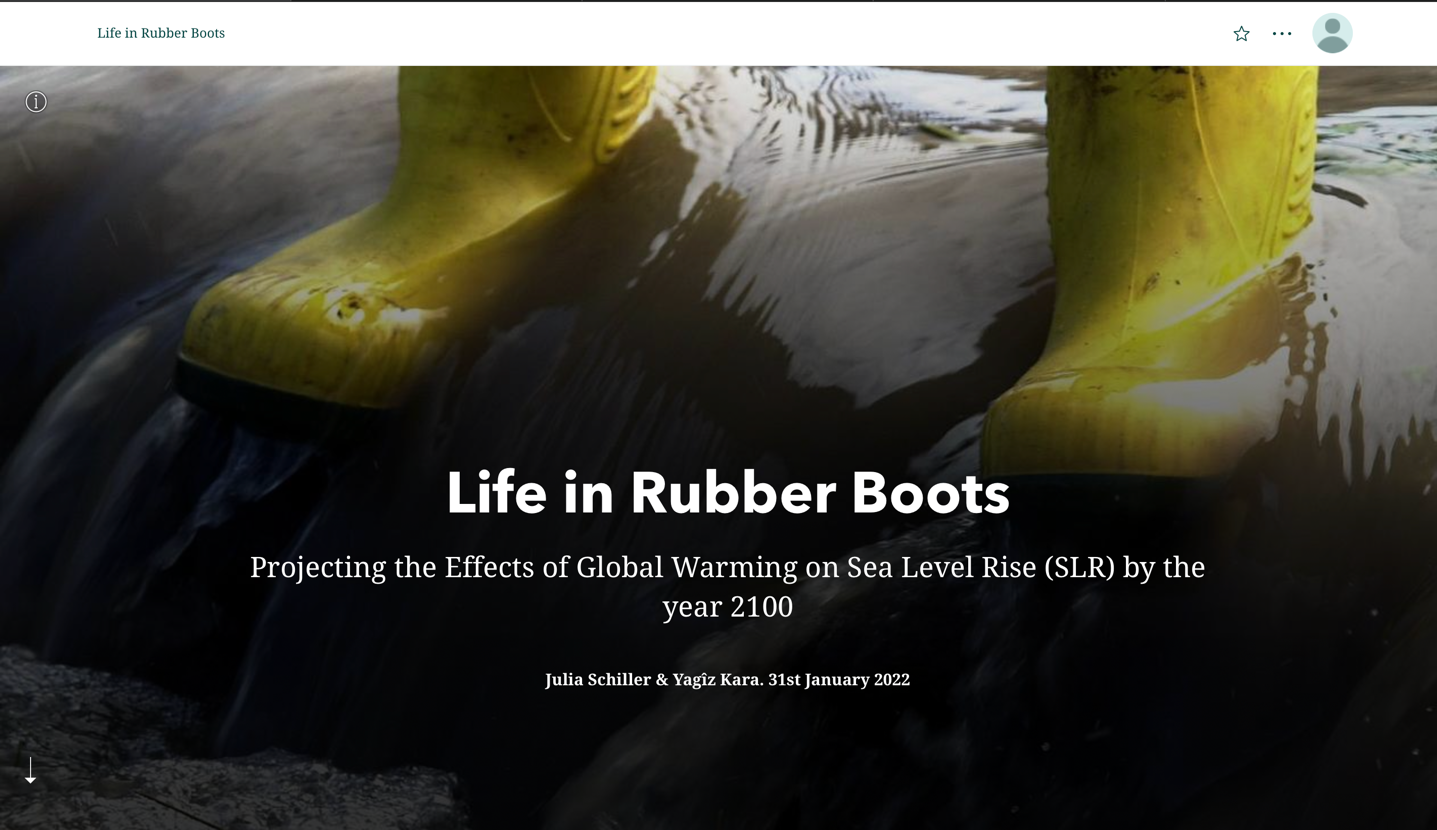
The cover page of our StoryMap.
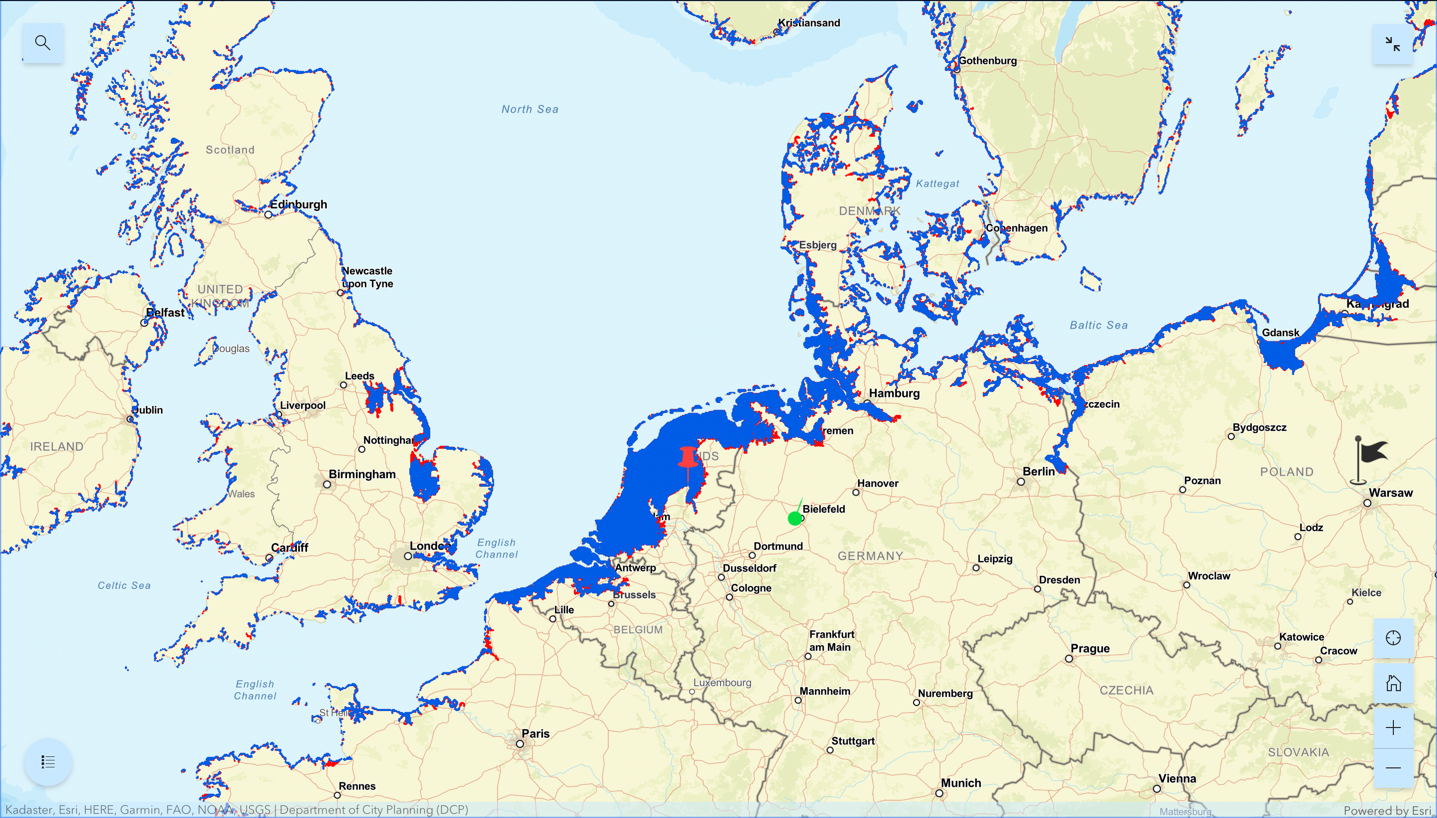
Zoomed in on the northern part of central Europe to see more clearly where the land will be inundated.
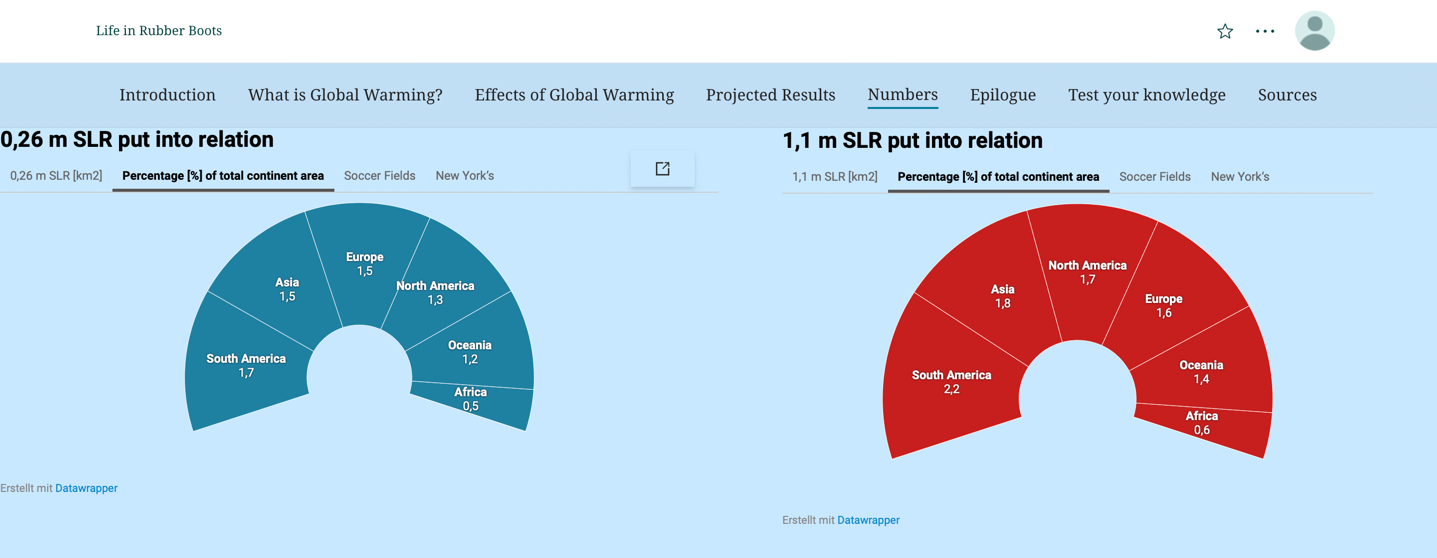
The inundation percentages of each continent in relation to the total individual continent areas.
Sources
[1] Oppenheimer, M. et al. (2019). Sea Level Rise and Implications for Low-Lying Islands, Coasts and Communities. In: IPCC Special Report on the Ocean and Cryosphere in a Changing Climate. 321-445.
Students
Julia Schiller
Yağız Kara
Yağız Kara
11th intake
Supervisors
Juliane Cron, M.Sc.
Dr.-Ing. Mathias Jahnke
Dr.-Ing. Mathias Jahnke
Keywords
Global Warming, Sea Level Rise, Floods, 2100
Try it