Magical Light Map – Urban Green Area Map
“Change the city layer to see Cartographer’s magic!”
What it is about
Green areas play an important role in urban life. Green areas can have an impact not only on environmental aspects, but also on the population life expectancy, physical and mental health, and beyond. This project can provide a physical tool to visually observe the distribution of green areas and the transportation connection to green areas in the city, and can compare the differences in green areas in different cities. At the same time, this project compares and analyzes the relationship between urban green area and urban life quality to observe the degree of impact of green area on urban life quality.
How we built it
The project is mainly divided into two parts: digital map and wooden map. The digital map part mainly includes the collection, processing and design of urban data. Firstly, we have to collect data including spatial data and other data we need from the Internet. For instance, in this project the green area data of each city is the most important for us. Then we have to process data by ArcGIS Pro, calculate areas by Excel, design layouts by Adobe Illustrator and make them available to laser cutters. With all of the data and a laser cutter, we can make our wooden maps with cardboards. We have to cut two layers for each city, a city layer with holes representing green areas and a road layer to show the connection to the green area. After everything is prepared, we design the wooden box by AutoCAD and cut it with MDF. At the end, we combine the city layer, road layer, wooden box and LED lights to show an urban green area map.
Challenges we ran into
Our biggest challenge should be learning how to make a map by laser cutter. First we need to think about making a vector map that can be used by the laser cutting machine, and before each cut we have to do a lot of small tests to make sure the correct laser power, speed and frequency are used. Of course, it is worth mentioning that collecting and processing geographic data of different cities to make sure it could be available to a laser cutter is also a big challenge. But luckily at the end we are very familiar with the process of making a wooden map. We also faced some challenges related to the design of a physical product, decisions between whether to use or not the same scale for all maps, or defining the amount of details that we should present on different scales, were challenges that a cartographer could face especially with this type of non-digital project.
What we're proud of
Although we were slow at the beginning when faced with many unfamiliar things, in the end we felt like we had learned a lot. We made a really cool map box, and most importantly our map layers are replaceable so people can show different maps with different topics. In addition to this project, we have many more ideas that can be realized with a laser cutter. This project really inspired us a lot. We are also proud of the good working environment that we had through the semester. We started being strangers but then found out we had some common interests and although we could feel some pressure now and then, we managed to enjoy the process.
What we learned
After a semester of study and hard work, we learned a lot of what we need as a cartographer and learned a lot of new skills from the makerspace. We learned how to find the data we need from various databases, and process and filter the huge data in ArcGIS Pro to get the results we want to display. We learned some design skills and the importance of conscious design when it comes to printed maps. We also learned how to use Adobe Illustrator to import map data and design layouts. More importantly we learned how to operate a laser cutter to make what we need from the makerspace.
What's next
At present, we have completed green area maps for 7 cities. In the future, we can make more green area maps of other cities, or make map layers with other topics. At the same time, we are also considering simplifying the current map and designing a more portable wooden map that can be widely used in more scenes.
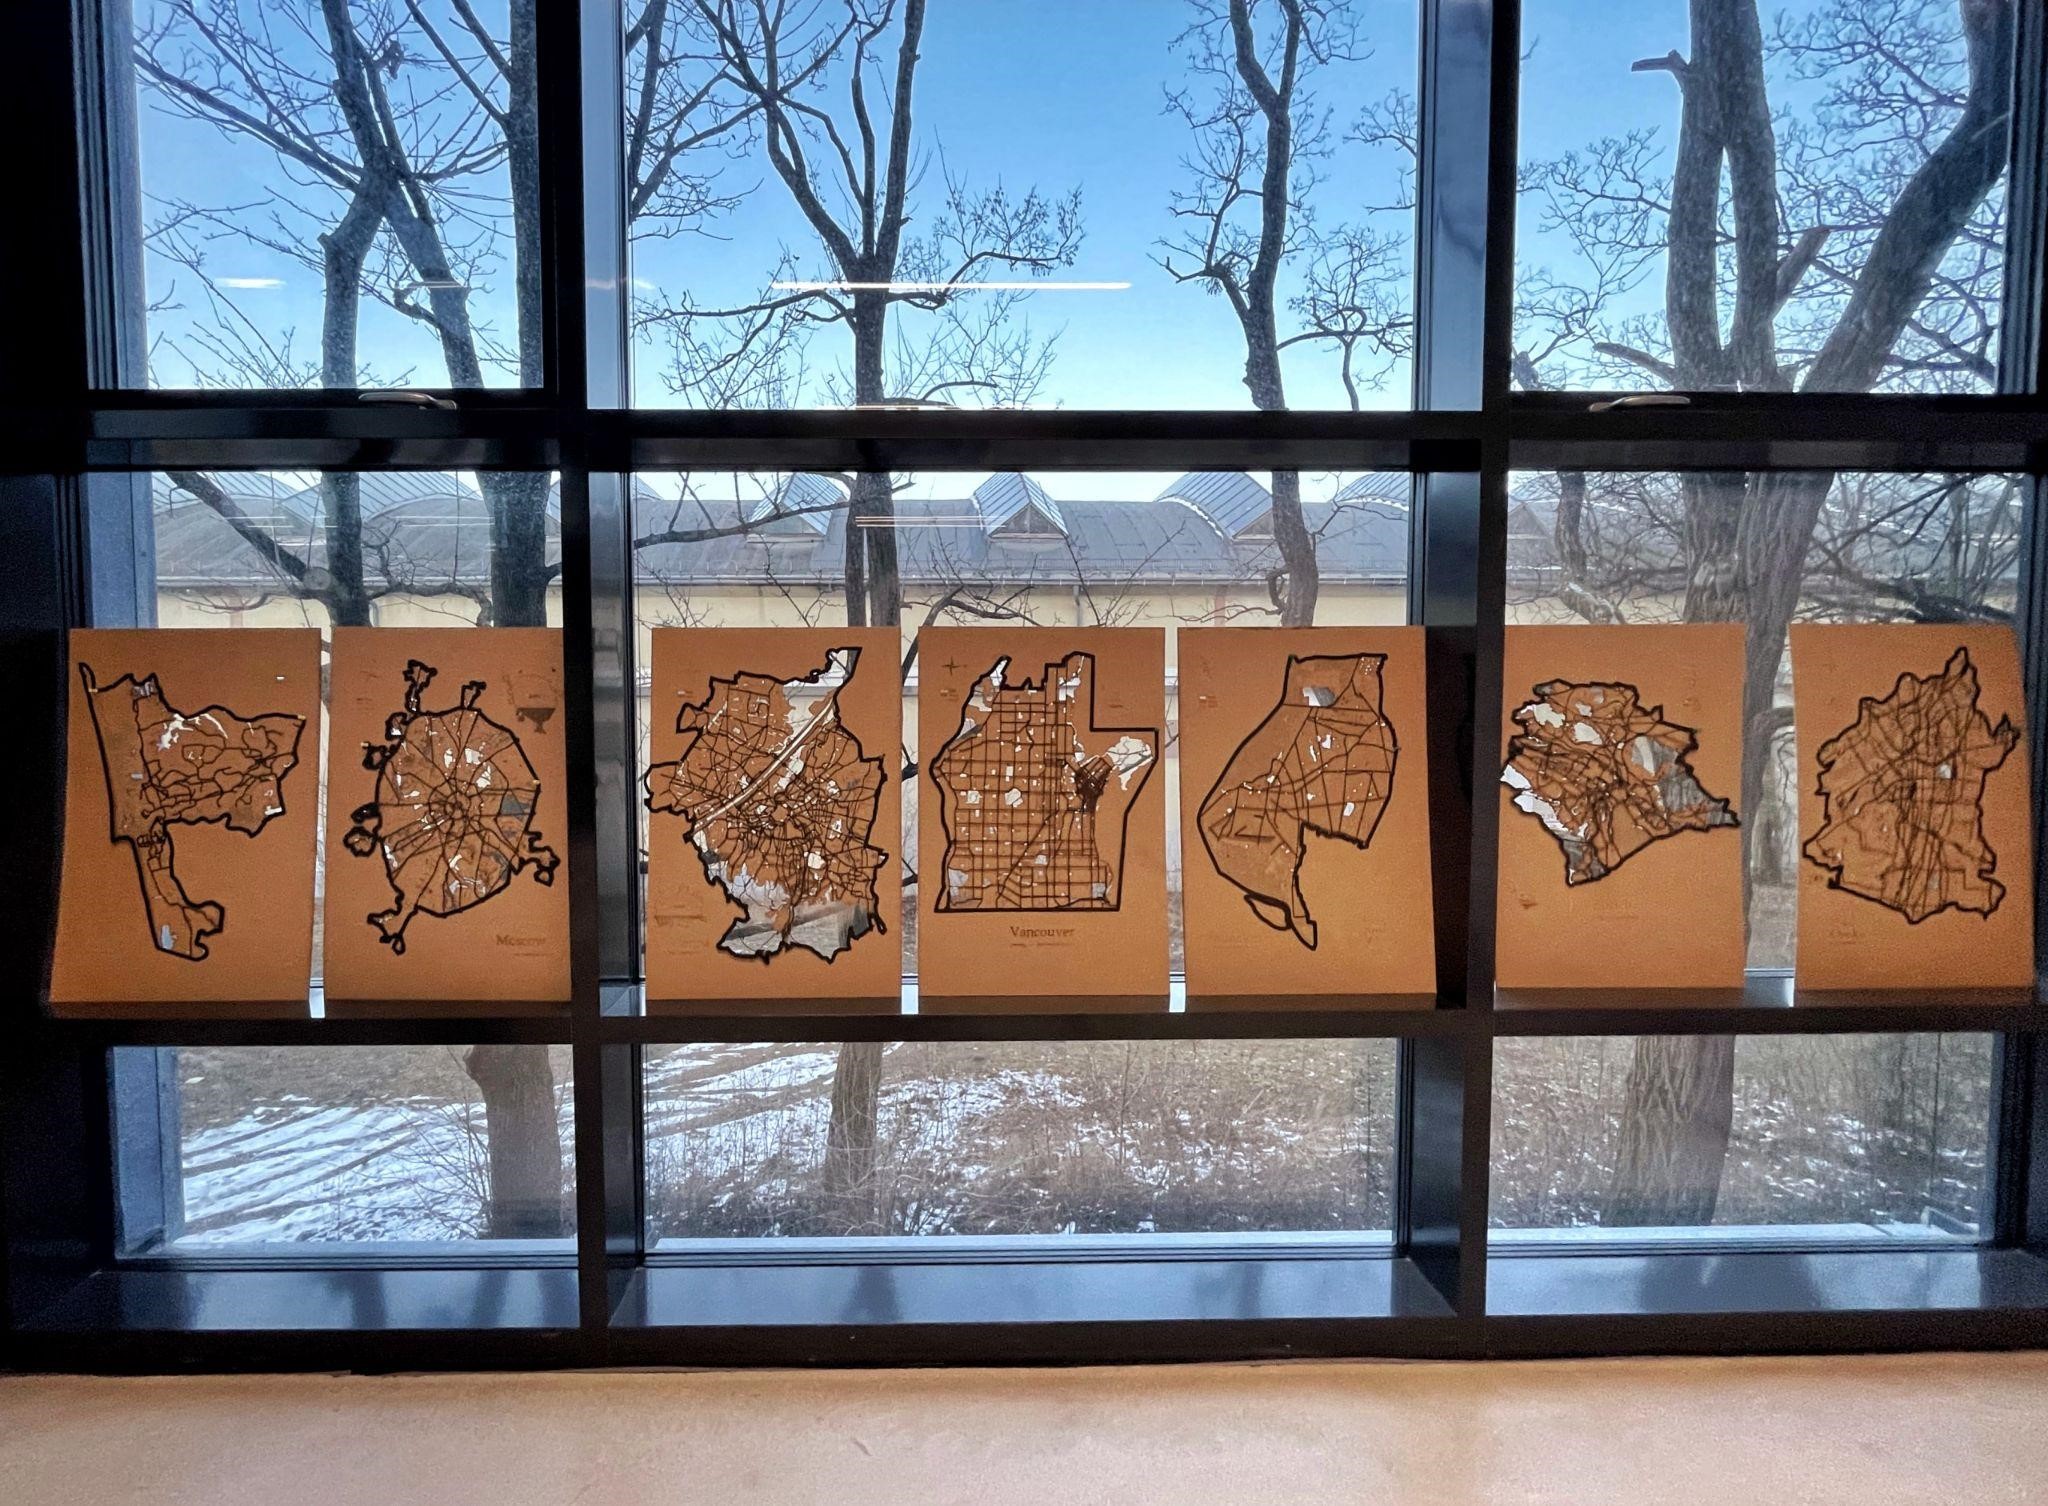
City maps with road layers.
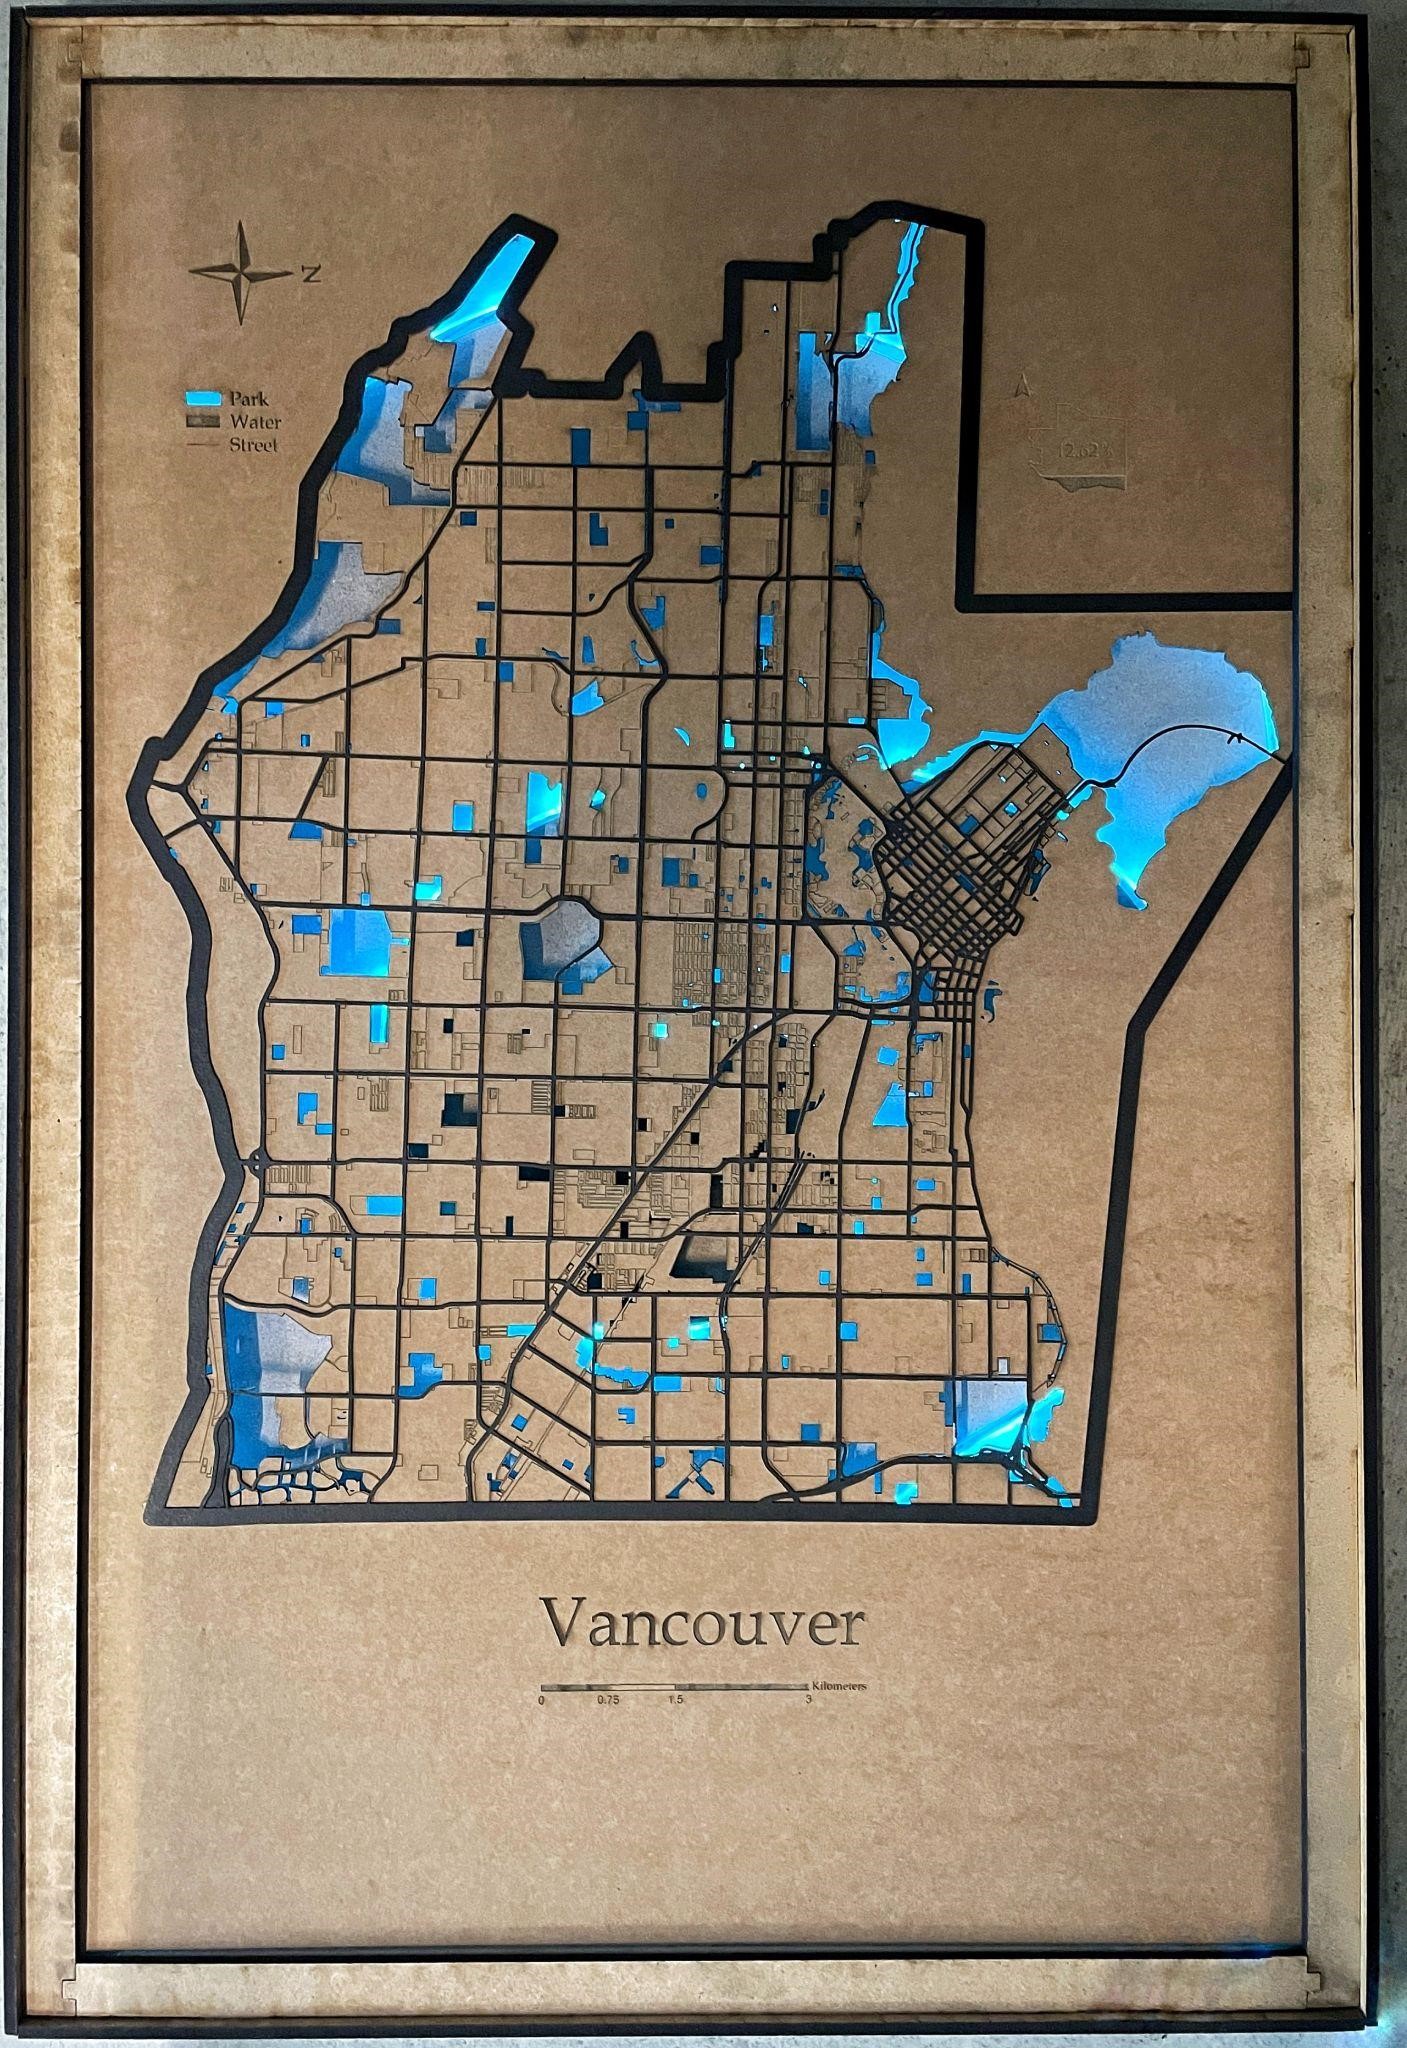
The light map of Vancouver.
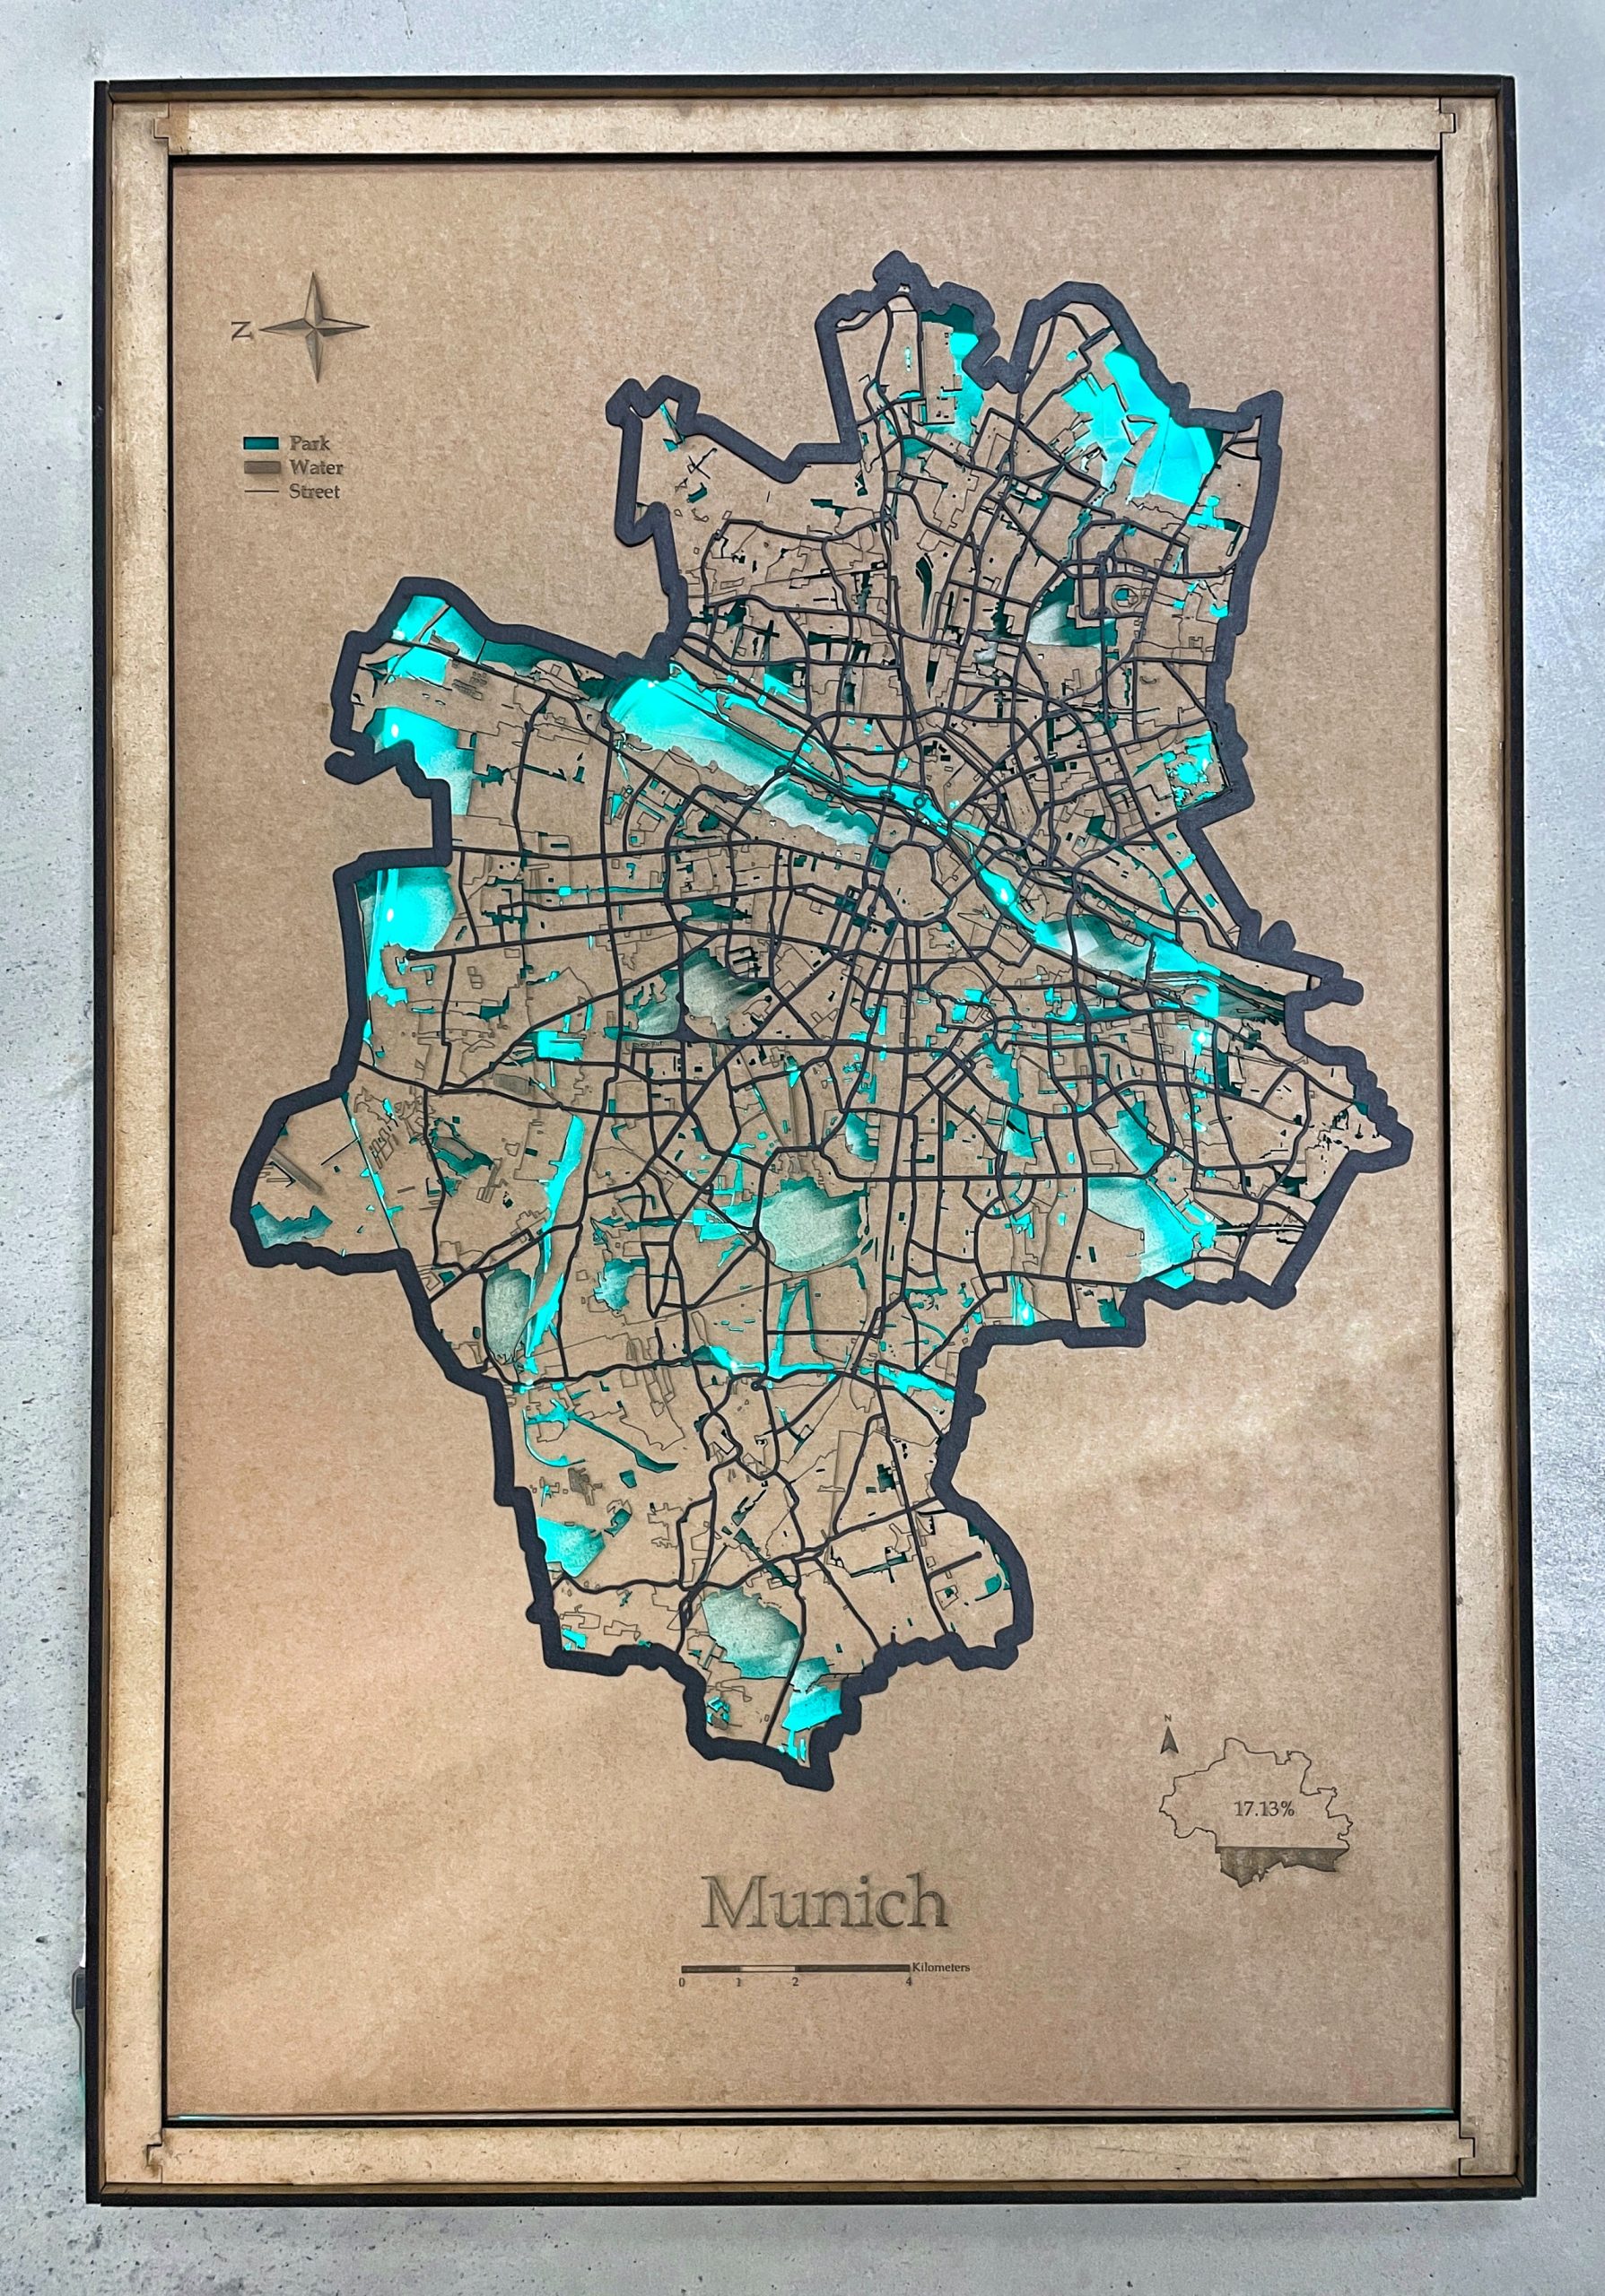
The light map of Munich.
Sources
[1] Open Street Map
[2] The Global Liveability Index 2019, The Economist.
[3] Vienna map data from https://www.data.gv.at/
[4] Vancouver map data from https://opendata.vancouver.ca/pages/home/
[5] Asunción map data from https://www.asuncion.gov.py/arcgis/rest/services
[2] The Global Liveability Index 2019, The Economist.
[3] Vienna map data from https://www.data.gv.at/
[4] Vancouver map data from https://opendata.vancouver.ca/pages/home/
[5] Asunción map data from https://www.asuncion.gov.py/arcgis/rest/services
Students
Manuela Londoño Jiménez
Jiapan Wang
Jiapan Wang
11th intake
Supervisors
Juliane Cron, M.Sc.
Dr.-Ing. Mathias Jahnke
Dr.-Ing. Mathias Jahnke
Keywords
Green Areas, Life Quality, Wooden Map, Laser Cutter
