This interactive map helps to analyze the socio-economic impacts of Covid-19 on top economies of the world. It uses three parameters such as GDP, Unemployment and fiscal stimulus by government to give an understanding of the catastrophic impact that this pandemic has made. The developing and under-developed nations have lost decades of growth. Even developed nations are struggling with their crippling economy and large unemployed population. Small and medium scale industries have been hit badly all over the world. This map is intended to give its users an idea of the present situation as well as the predictions in the coming time. These predictions are based on assumptions that we will not have another similar wave of the virus this year forcing another stringent lockdown. This map can be interacted using three main tabs provided on the top namely GDP, Unemployment and Spending. It also has a sidebar which automatically switches as per users selected parameters. This sidebar helps to analyze all the parameters at the same time. The time slider present in the map helps to analyze changes from 2019 to 2021.
Covid-19 impacts on major economies of the world
“Tracking economy during the pandemic.”

Snapshot of the webmap.
What it is about
How we built it
This map is a result of tremendous team work between the three team members and the supervisors. In the making, the initial idea has been reconsidered a lot of times to make it more related to the users and easy to use. Lot of analysis has been made regarding cartographic techniques and visualization. Project supervisors have been contacted frequently to make this idea a reality. This map has been fully programmed in Javascript. We have tried to consider everything we could, to make the project better and useful. A lot discussions and meetings have taken place both online and offline to keep it engaging. Proper care has been administered in the data collection process to make it more authentic and legitimate. Each team member has played their part to the best of their ability. Majk’s invincible knowledge of programming was an asset to the team during the troubleshooting. Even though it was a difficult time to work as a team, we tried our best to get most out of it.
Challenges we ran into
For the team, the biggest challenge was the collection of most legitimate data possible. We have invested our large amount of time for the collection of data form different sources. For countries like China and Brazil, the data was not available in a very useful manner. We tried different sources to verify these data. We also had some issues with our codes time to time. Finding bugs in the code took a lot of time. The visualization part was also a challenge at the best as the data was very limited. But with focused and dedicated team members, it happened to be finished in time. Managing time with a couple of other projects running side by side was also very challenging.
What we're proud of
This map could be a good platform for someone who wants to study the impacts on pandemic on top economies. After all the difficulties, we managed to finish the project in time, and to our own level of satisfaction. At the beginning, we were very unclear that how are we going to make our proposal a reality. All of us were from different cultural and educational background and we were working together for the first time, but it never turned out as an obstruction during this project. But with positive attitude and good team spirit, it turned out way better than we had expected. We are very proud of our team, with members having different professional backgrounds but exceptionally well co-ordination.
What we learned
With positive attitude and dedication, difficult things can be achieved. A good team work can lead to an achievement which is sometimes impossible to achieve on your own. We developed a better understanding in coding an interactive web map in javascript. A good guidance is equally important to make your ideas a reality. There were several moments where we learned a lot of things from each other.
What's next
As of now this map has fixed data but we are looking forward to get this map an automatic data fetching system so that the map can remain updated to latest data possible. We are also looking forward to create a mobile version of this map. Because of this project we have got an amazing team and we are looking forward to work on more projects together. We have also bought a domain for our team and we will be publishing all our work on our website in future. We really enjoyed working together and now we share a much stronger bond than we had at the beginning of this semester.
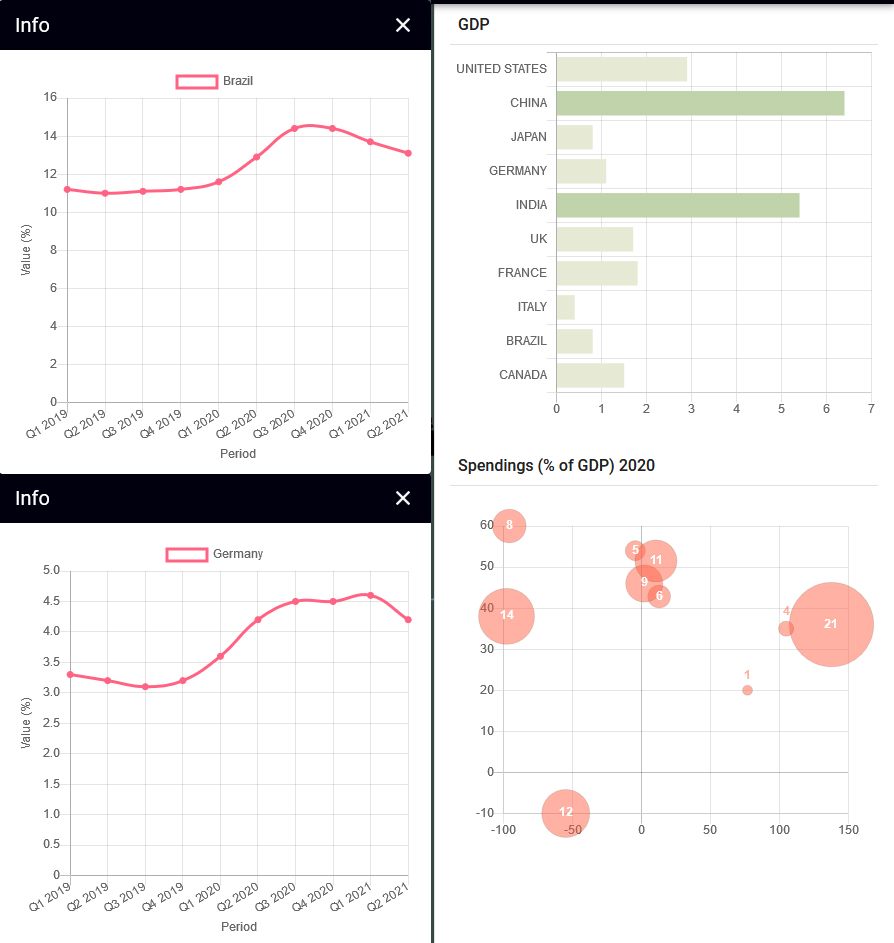
Interactive panes for detailed visualization.
Students
Majk Shkurti
Syed Miftah Zeya
Alexandros Theofanidis
Syed Miftah Zeya
Alexandros Theofanidis
10th intake
Supervisors
Juliane Cron, M.Sc.
Dr.-Ing. Mathias Jahnke
Dr.-Ing. Mathias Jahnke
Keywords
Covid-19, GDP: Gross Domestic Product
Try it