As there has been a strong impact on both physical and psychological health due to the pandemic, a radical shift of safety perception in regards to public spaces has occurred. Therefore, there is a need to visualize these changes and reflect our daily interactions with our city, and then bring some insights about urban environment construction and public health risks management for decision-makers. Also, it may help citizens to have a better understanding of the change they have experienced towards what it means to be “Safe”.
Covid Reshaping the Perception of Safety
Through a series of “before-after” choropleth maps, this mapping project is to convey how COVID-19 has changed our perception and interaction with the city.
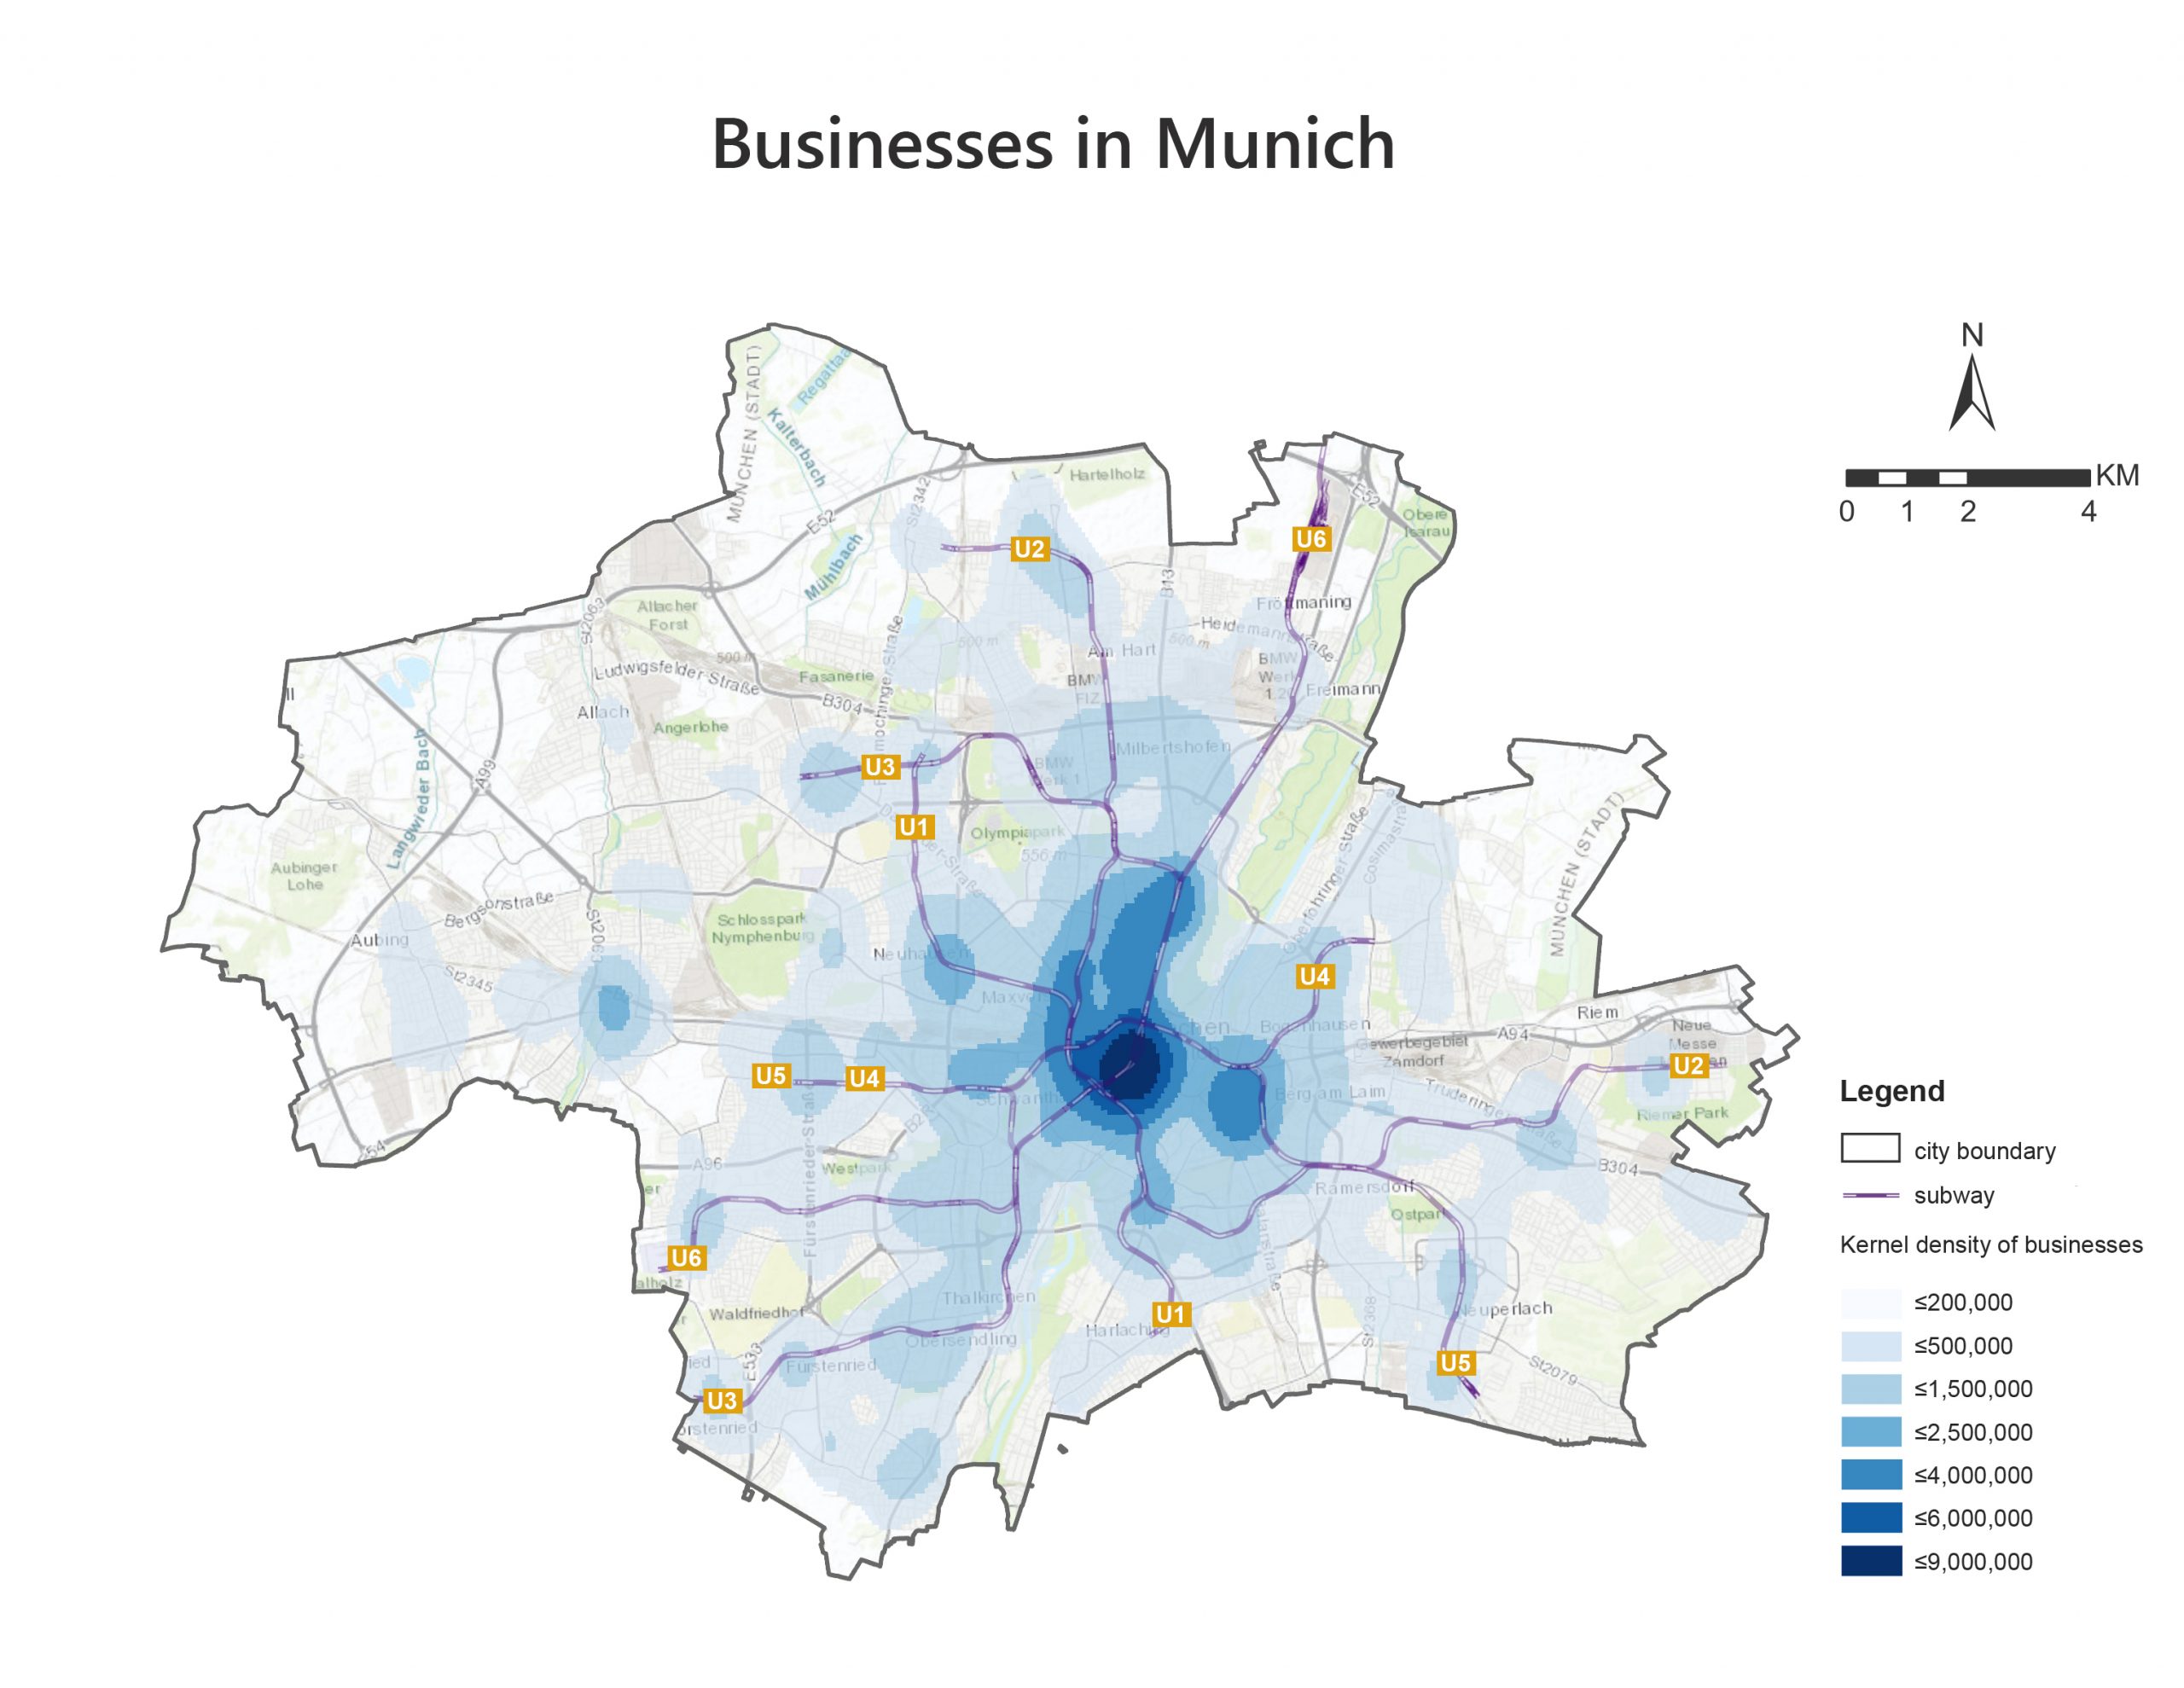
This heat map shows the distribution of 10 types of places which we look into in Munich, including restaurants, bars, supermarkets, gyms, parks, etc.
What it is about
How we built it
To best reflect the changes that people have faced during this pandemic, we used a series of “Before-After” choropleth maps and also some graphs to help tell the story.
We first made the online survey to get to know what citizens in Munich thought about their changes of safety perception and frequency of attendance before and during the pandemic. Then we allocated scores to each type of place based on the answers of survey respondents. Afterwards we aggregated the scores of all places and divided it with the district area to have relative indexes.
Challenges we ran into
This project is oriented on a simple base approach, meaning that we started with a simple premise “How COVID-19 has reshaped our perception of Safety?”. At first glance this seems to be a simple question to answer. However, as we started elaborating the survey and the scoring systems, we realized that we easily found ourselves over extending the scope of the project. Staying always within the lanes of the objectives proved to be harder than what we foresaw.
What we're proud of
We are the proudest to deliver a finished project that achieved the set goals on the proposed time frame. We believe that due to our curious nature we are prone to set ambitious projects, making it easy to underestimate the time and skill required to achieve certain objectives. However, in our case we were able to deliver a high-quality study and successfully transfer the content to an online format. The whole process enhanced both our academic and technical skills.
What we learned
As a set of pre-defined areas is colored in proportion to a statistical variable, choropleth maps provide an easy and fast way to get a comparative glance at the safety perception change. Though in comparison to other mapping techniques, choropleth maps look simply to make. A considerable number of technicalities are required to produce an aesthetically pleasing map that correctly conveys the situation.
What's next
Our project mainly contains two parts, the online survey and the visualization of changes. So far, we just made some direct visualization work of the survey results, such as the changes of safety perception and its reflections within Munich districts. If we want to better reflect these changes more in depth, much more analysis needs to be done, such as the overlay analysis of population density within the areas, the influence of parks, etc.
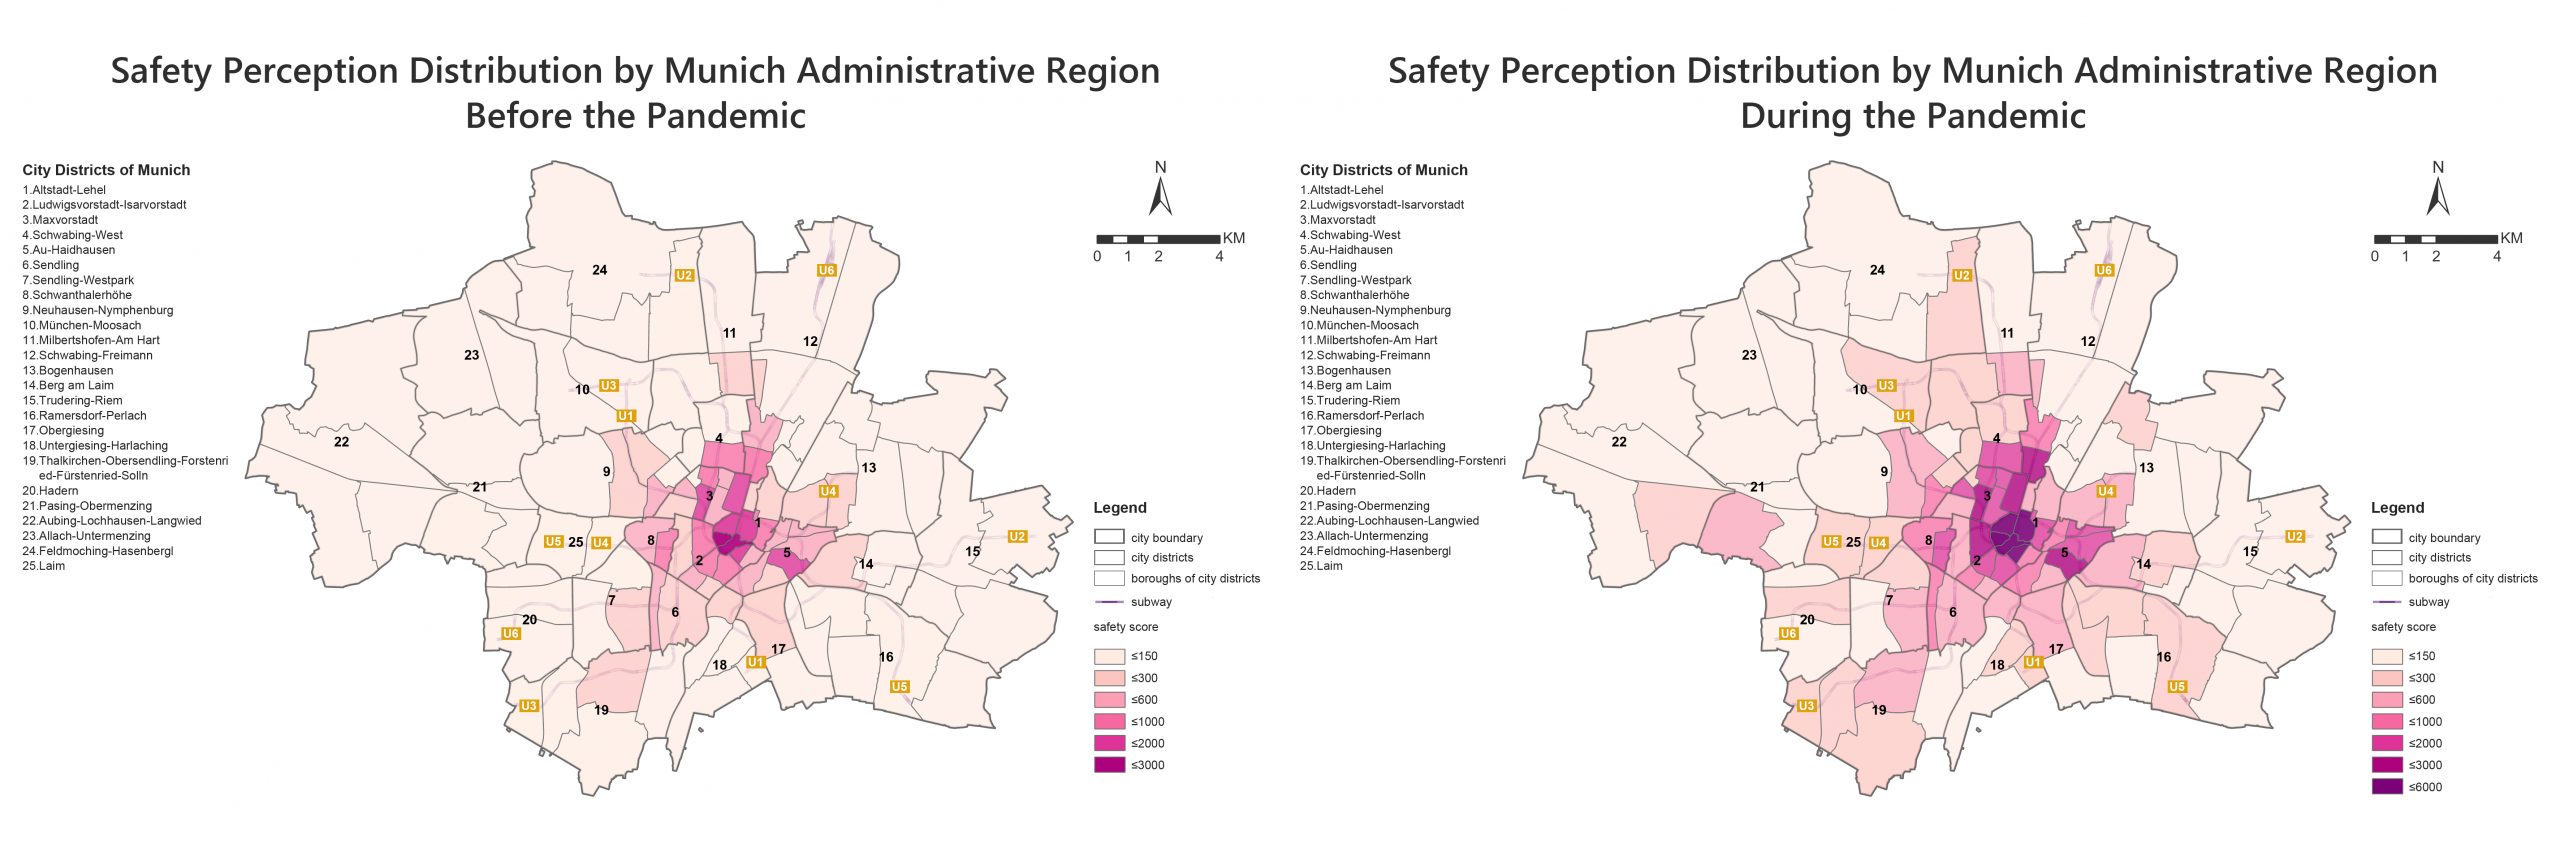
These two choropleth maps display the changes of safety level according to public opinions. Lots of districts became less safe during the pandemic, such as Schwabing-Freimann, Bogenhausen, Trudering-Riem and Ramersdorf-Perlach. At the meantime, central areas always perform as less safer places.
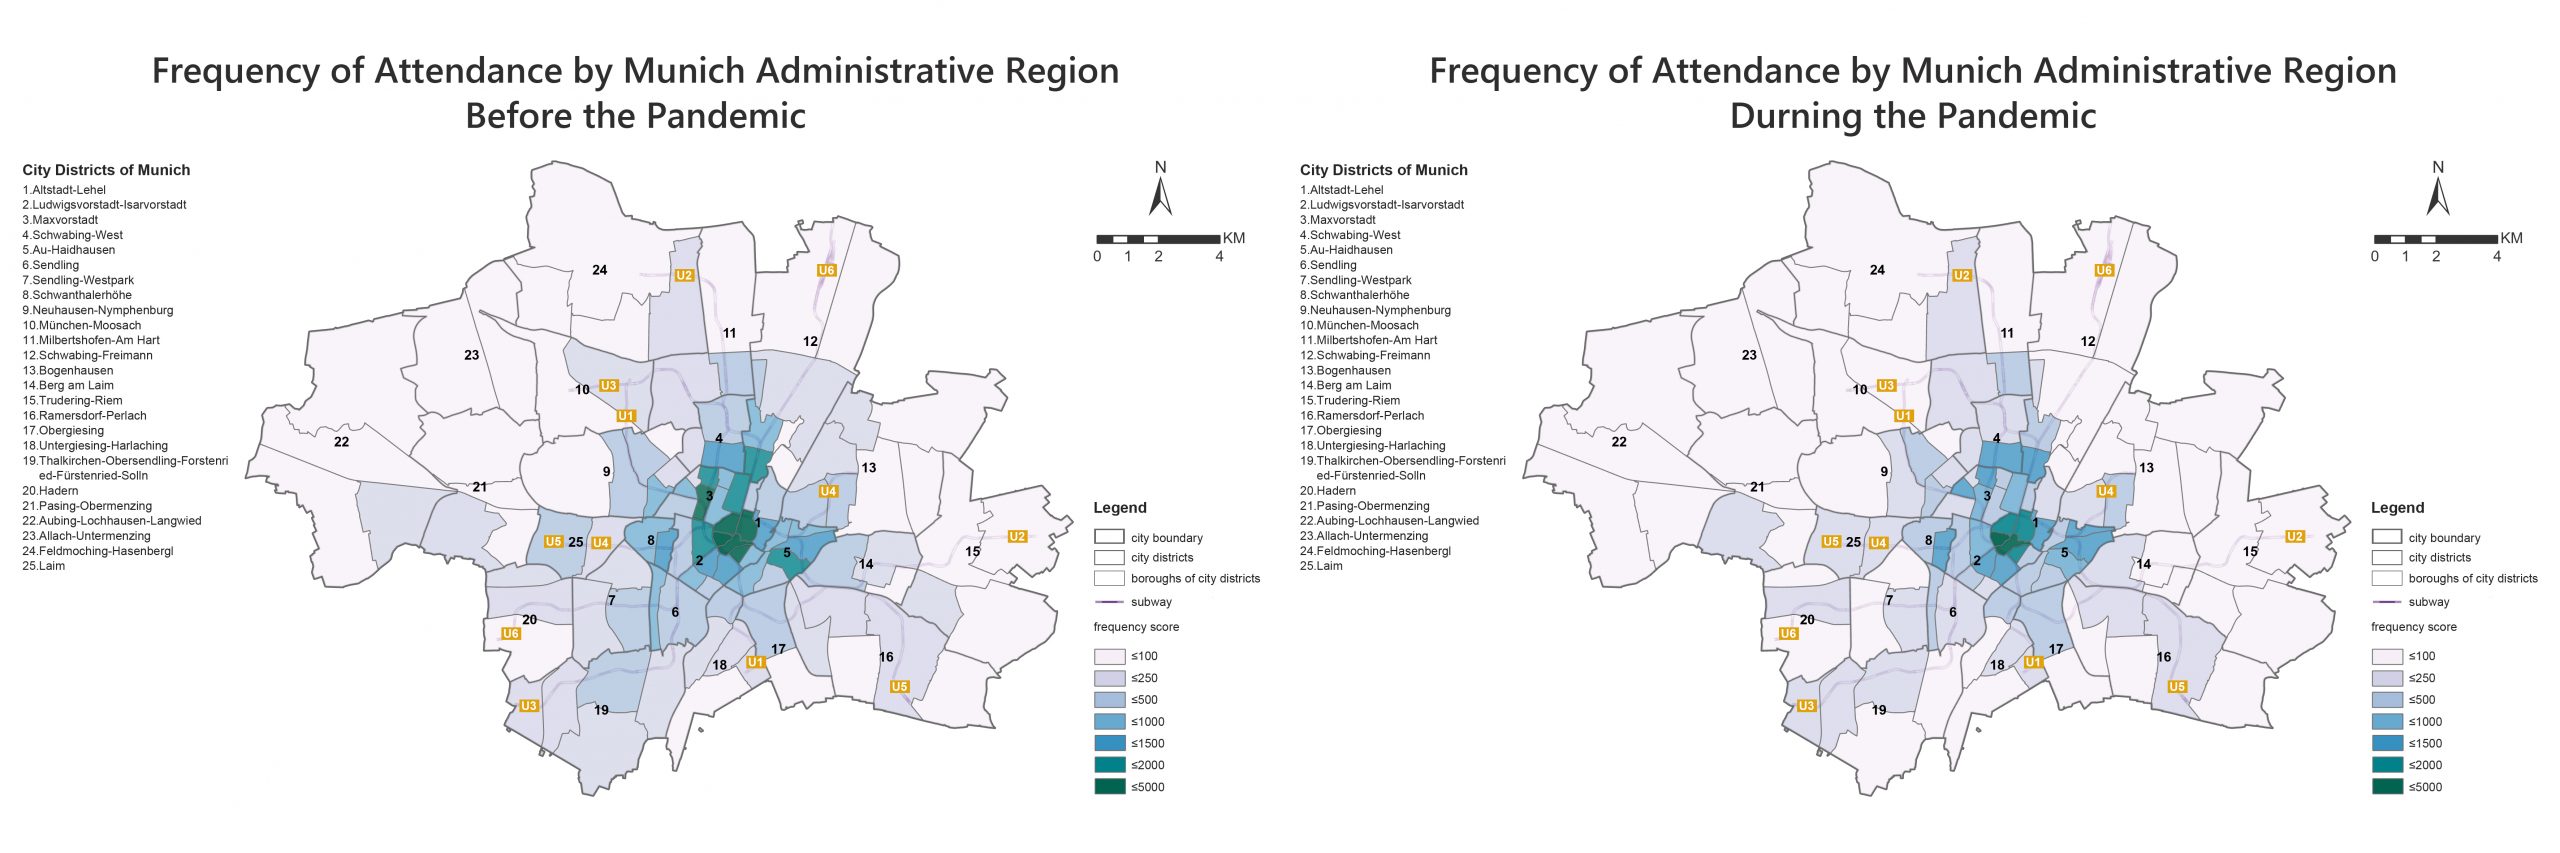
These two choropleth maps demonstrate the frequency level of places which were most likely visited by citizens. The general travelling frequencies declined as many districts changed to light colors during the pandemic, but the central area of Munich still shows a higher level of frequency especially Altstadt-Lehel, Ludwigsvorstadt-Isarvorstadt, Maxvorstadt and Schwabing-West.
Team working via Zoom though in different time zones!
Students
Zhuo Yang
José Pablo Ceballos Cantu
José Pablo Ceballos Cantu
10th intake
Supervisors
Juliane Cron, M.Sc.
Dr.-Ing. Mathias Jahnke
Dr.-Ing. Mathias Jahnke
Keywords
COVID-19, Safety Perception, Frequency
Try it