Can you see clearly now? Monitoring the Effects of Air Quality in India During the COVID-19 Lockdown
“Telling the story of PM10 pollution in India during lockdown with qualitative and quantitative data.”
What it is about
India’s 1.37 billion people are exposed daily to high levels of airborne particulate matter, increasing risk of cancer and cardiovascular and respiratory disease [1]. This year, many countries saw decreases in air pollution as their economies slowed due to both lockdowns and a general lagging of the economy caused by the COVID-19 pandemic. On the 25th of March India went into a nationwide lockdown, which lasted officially until May 31st. This project aimed to visualize and analyze the effects of the lockdown on air quality and to assess people’s responses to any changes.
How we built it
Air quality data was collected from OpenAQ and the Central Pollution Control Board (CPCB) of India for 2018, 2019, and 2020. Weekly aggregates of PM10 data for each monitoring station were interpolated to a hexagonal grid for a time series map. A voluntary survey was deployed to gauge people’s perception of the air quality before and after the lockdown and how any changes affected them personally. The results are presented in an ArcGIS StoryMap, which includes an interactive dashboard to visualize the change of PM10 and an interactive web app to display the survey results.
Challenges we ran into
We used a robust but not readily accessible dataset, which required some nifty code to efficiently collect the data. Adapting applications such as ArcGIS web apps and Tableau to create the final product to our liking was also a challenge.
What we're proud of
From the beginning, we wanted to research a real-world issue that could have an impact for people on the ground. We wanted to deploy a product that was narrative and easy to read.
What we learned
We took the opportunity to use softwares and platforms that were completely new to us. This also helped teach us how to assess the limitations of a cartographic software before delving too deep into the project.
What's next
We would like to make some improvements on the rendering and the time slider on the dashboard. Overall, the next steps are to integrate more quantitative data and to dig deeply into available data for a more in-depth analysis of air quality trends.
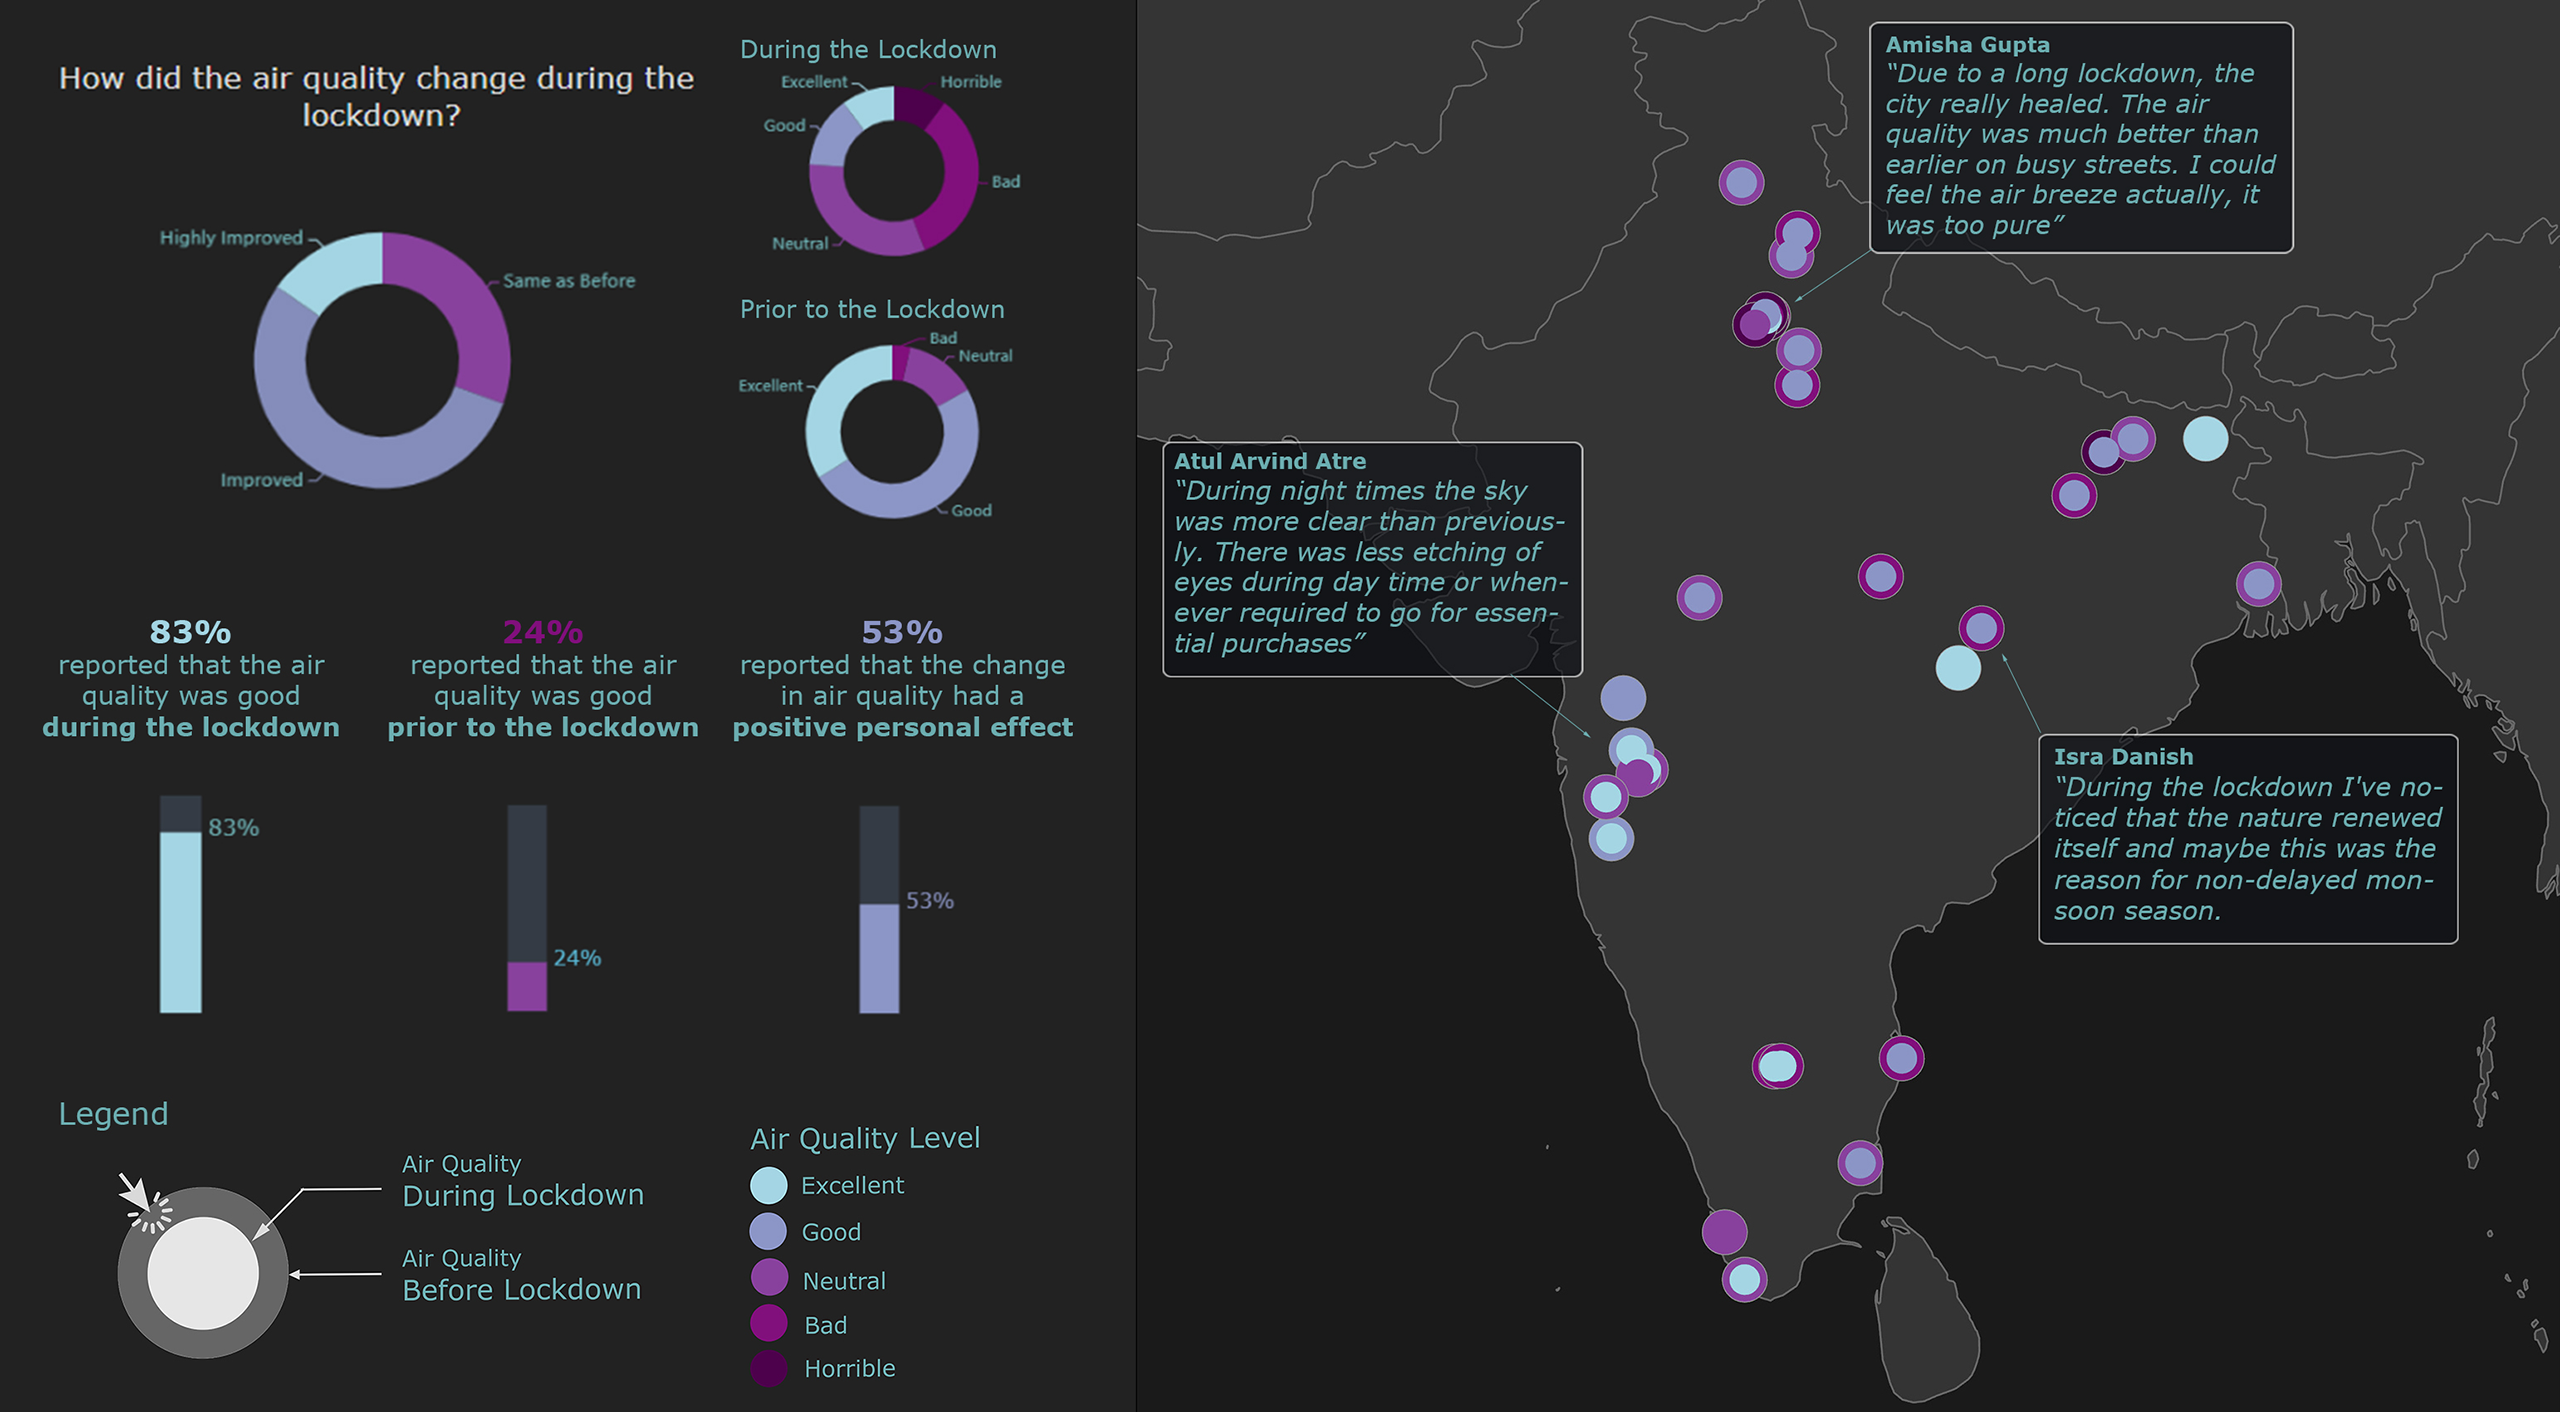
Snapshot of the web app included in the StoryMap.
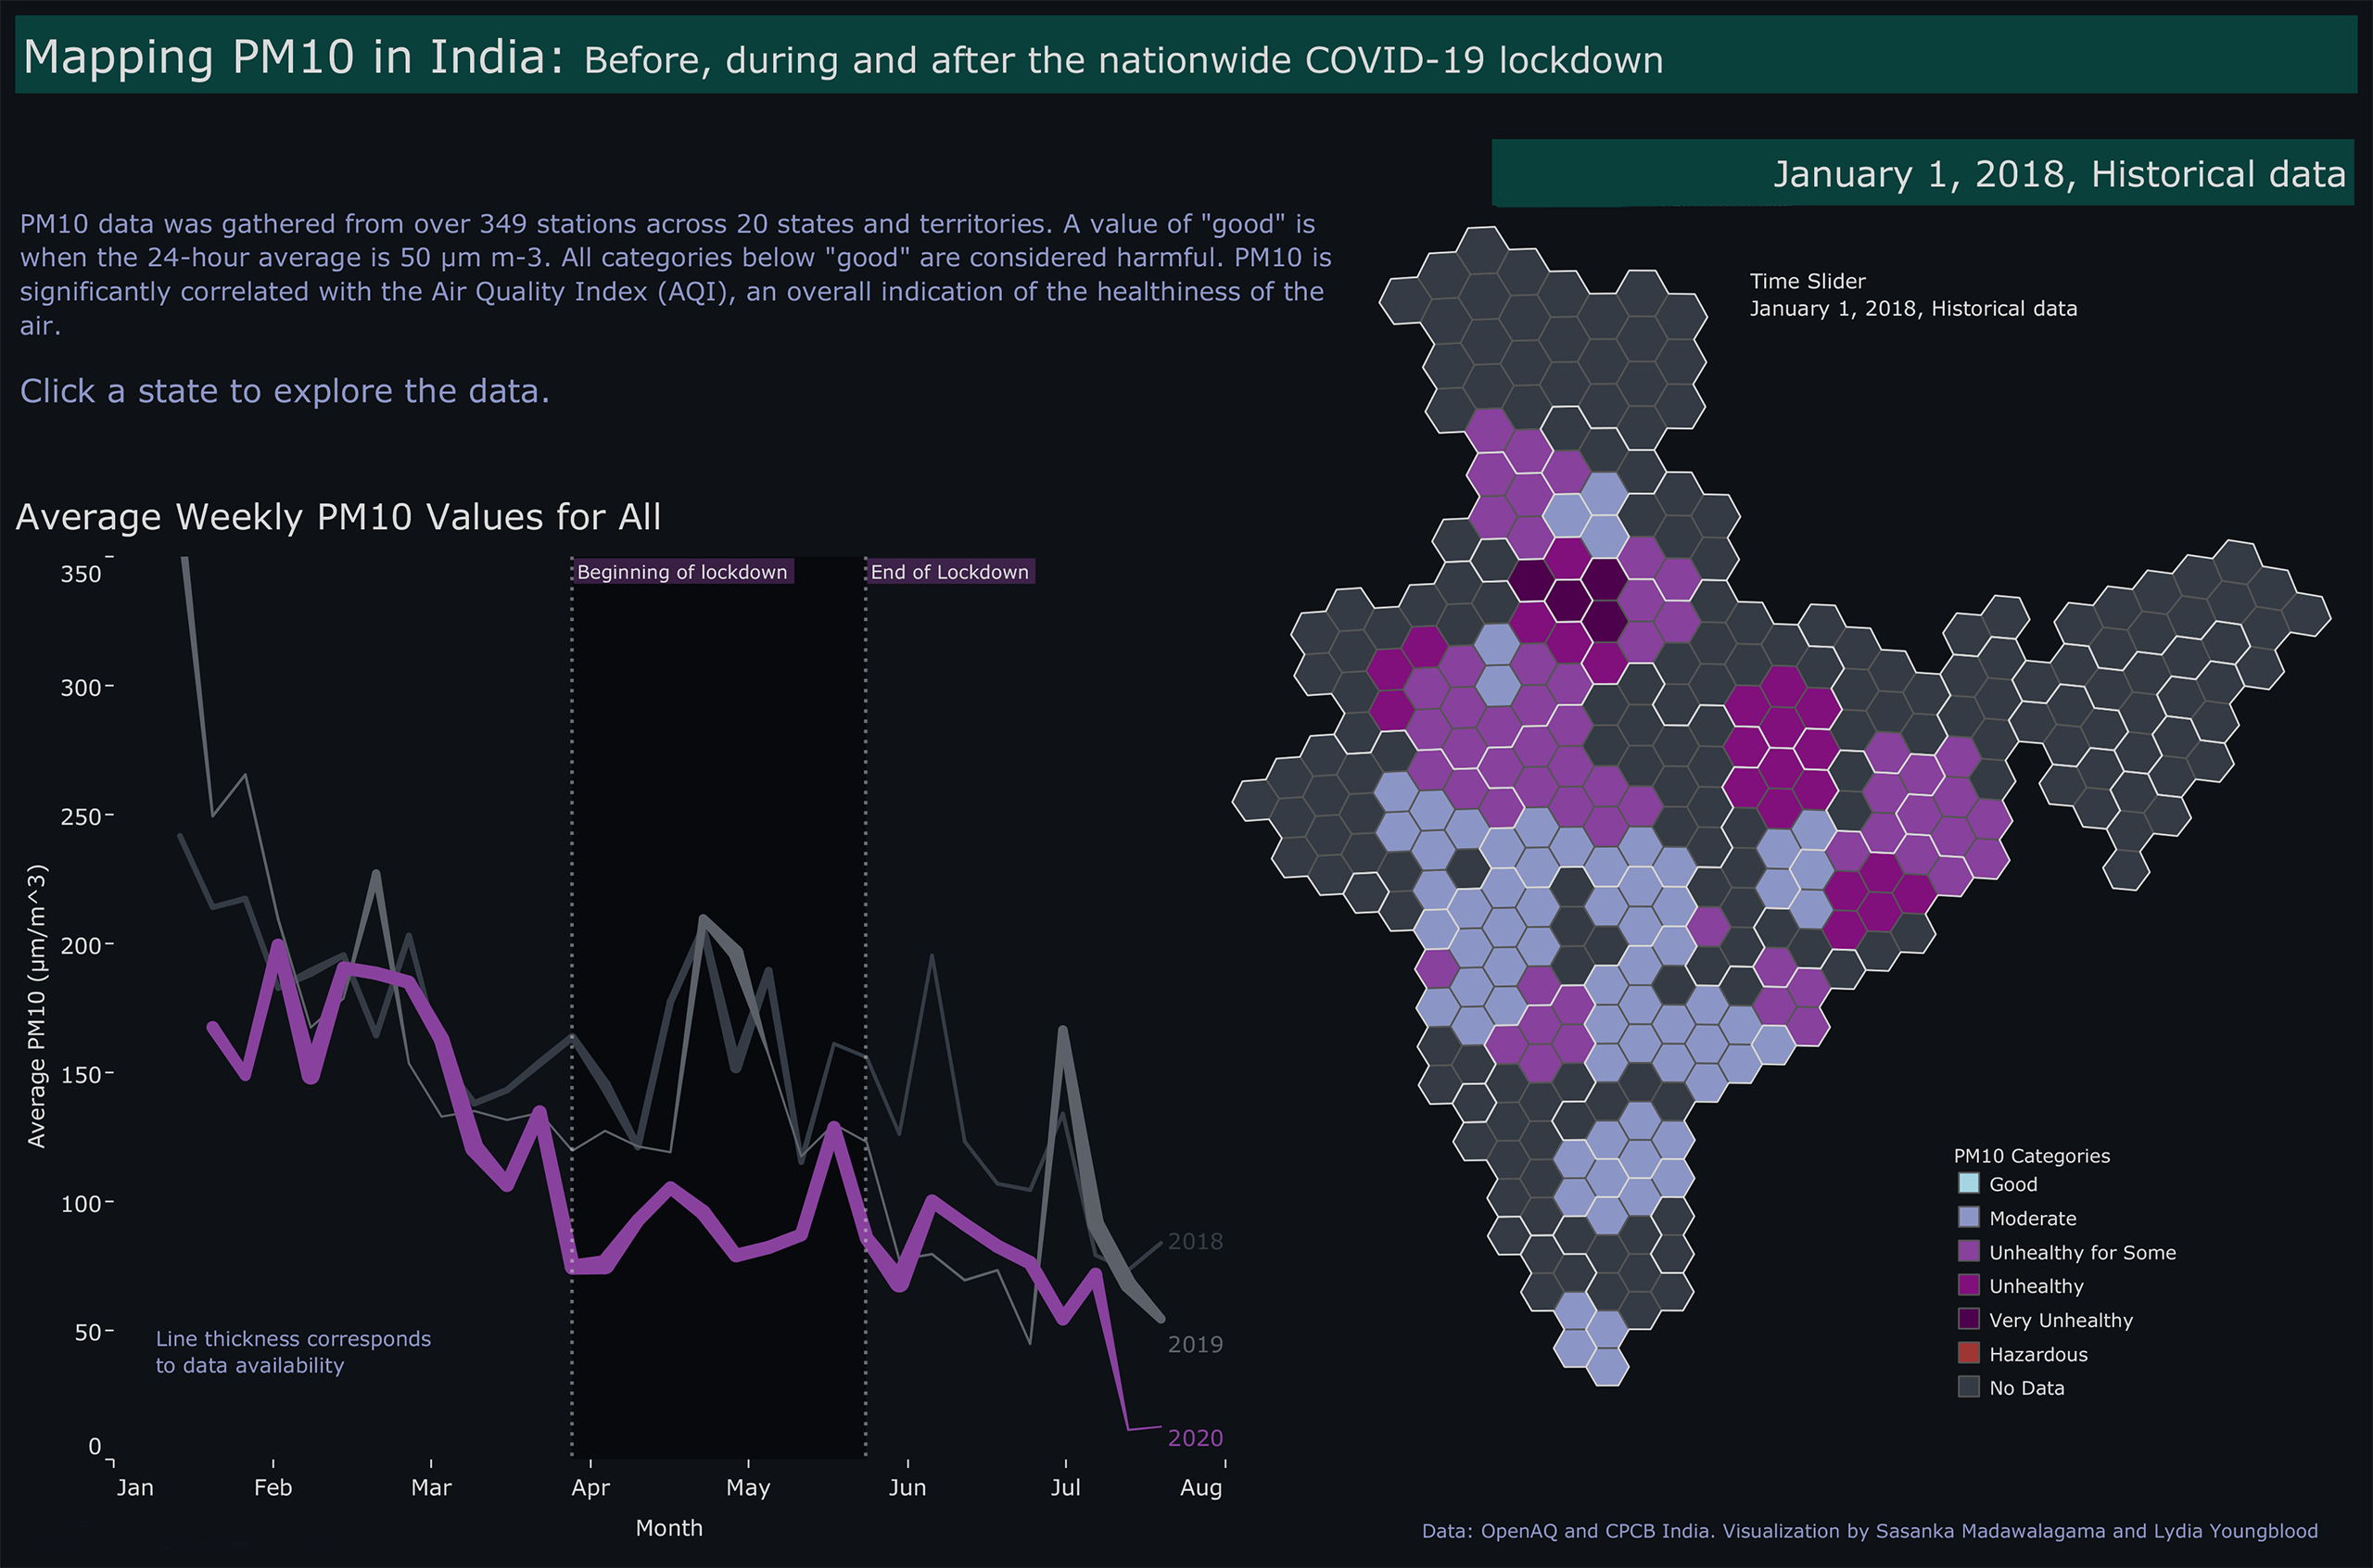
Snapshot of the dashboard included in the StoryMap.
Sources
[1] “Ambient (Outdoor) Air Pollution.” World Health Organization. World Health Organization, 2018. https://www.who.int/ en/news-room/fact-sheets/detail/ambient-(outdoor)-air-quality-and-health
Students
Lydia Youngblood
Sasanka Madawalagama
Sasanka Madawalagama
10th intake
Supervisors
Juliane Cron, M.Sc.
Dr.-Ing. Mathias Jahnke
Dr.-Ing. Mathias Jahnke
Keywords
COVID-19, Air quality, PM10
Try it