Searching for the Essentials
“Impacts of COVID-19 on Web Searches for Food & Other Necessities”
What it is about
When the COVID-19 pandemic hit the world, nearly every aspect of daily life was affected. The food industry, normally functioning unobtrusively, was shaken as people began hoarding products like pasta or toilet paper. Our interactive web map application aims to visualize the impact of COVID-19 on interests in food and other essential items in three European countries – Germany, the Netherlands, and the United Kingdom - based on Google Trends data of specific products [1].
How we built it
We used the Google Trends data from January 2019 to November 2020 and calculated the differences between 2019 and 2020 [1]. For the daily COVID-19 cases we collected the data from the World Health Organization (WHO) starting in January 2020 [2]. The interactive web application was built with Dash, an open-source Python library. Plotly, a scientific graphing Python library, was used to create the individual maps and graphs. The project is hosted on Heroku, a cloud platform which allows for deployment of Flask applications.
Challenges we ran into
One of the main challenges was deciding on how we wanted to visualize the data while there were fifteen variables per country. We decided on two different approaches for the visualizations. One approach focuses on the differences between countries for one search term, while the other approach focuses on the differences for all fifteen search terms in a country and between the countries.
What we're proud of
We are proud to have visualized the Google Search Trend data in an aesthetic and novel way. We’re especially proud that even though not all of us had experience with Plotly or Dash prior to working on the project we were all able to contribute. Also, we decided to use Git for collaboration, which was a learning experience in itself! Besides our project, we are proud that we remained positive even though the lockdown caused extra troubles.
What we learned
From this project we have learned how to deal with problems that we had not anticipated beforehand. We never gave up; we either searched for solutions or we came up with alternatives in order to achieve the most aesthetic and intuitive design for the project. We also learned a lot more Python and Git along the way.
What's next
The project focuses now on three countries and fifteen search terms. However, with more time this could be extended to more countries and more search terms. Another extension could be to compare the data with COVID-19 events of the countries, e.g. when the countries were in lockdown or when wearing a facemask became mandatory.
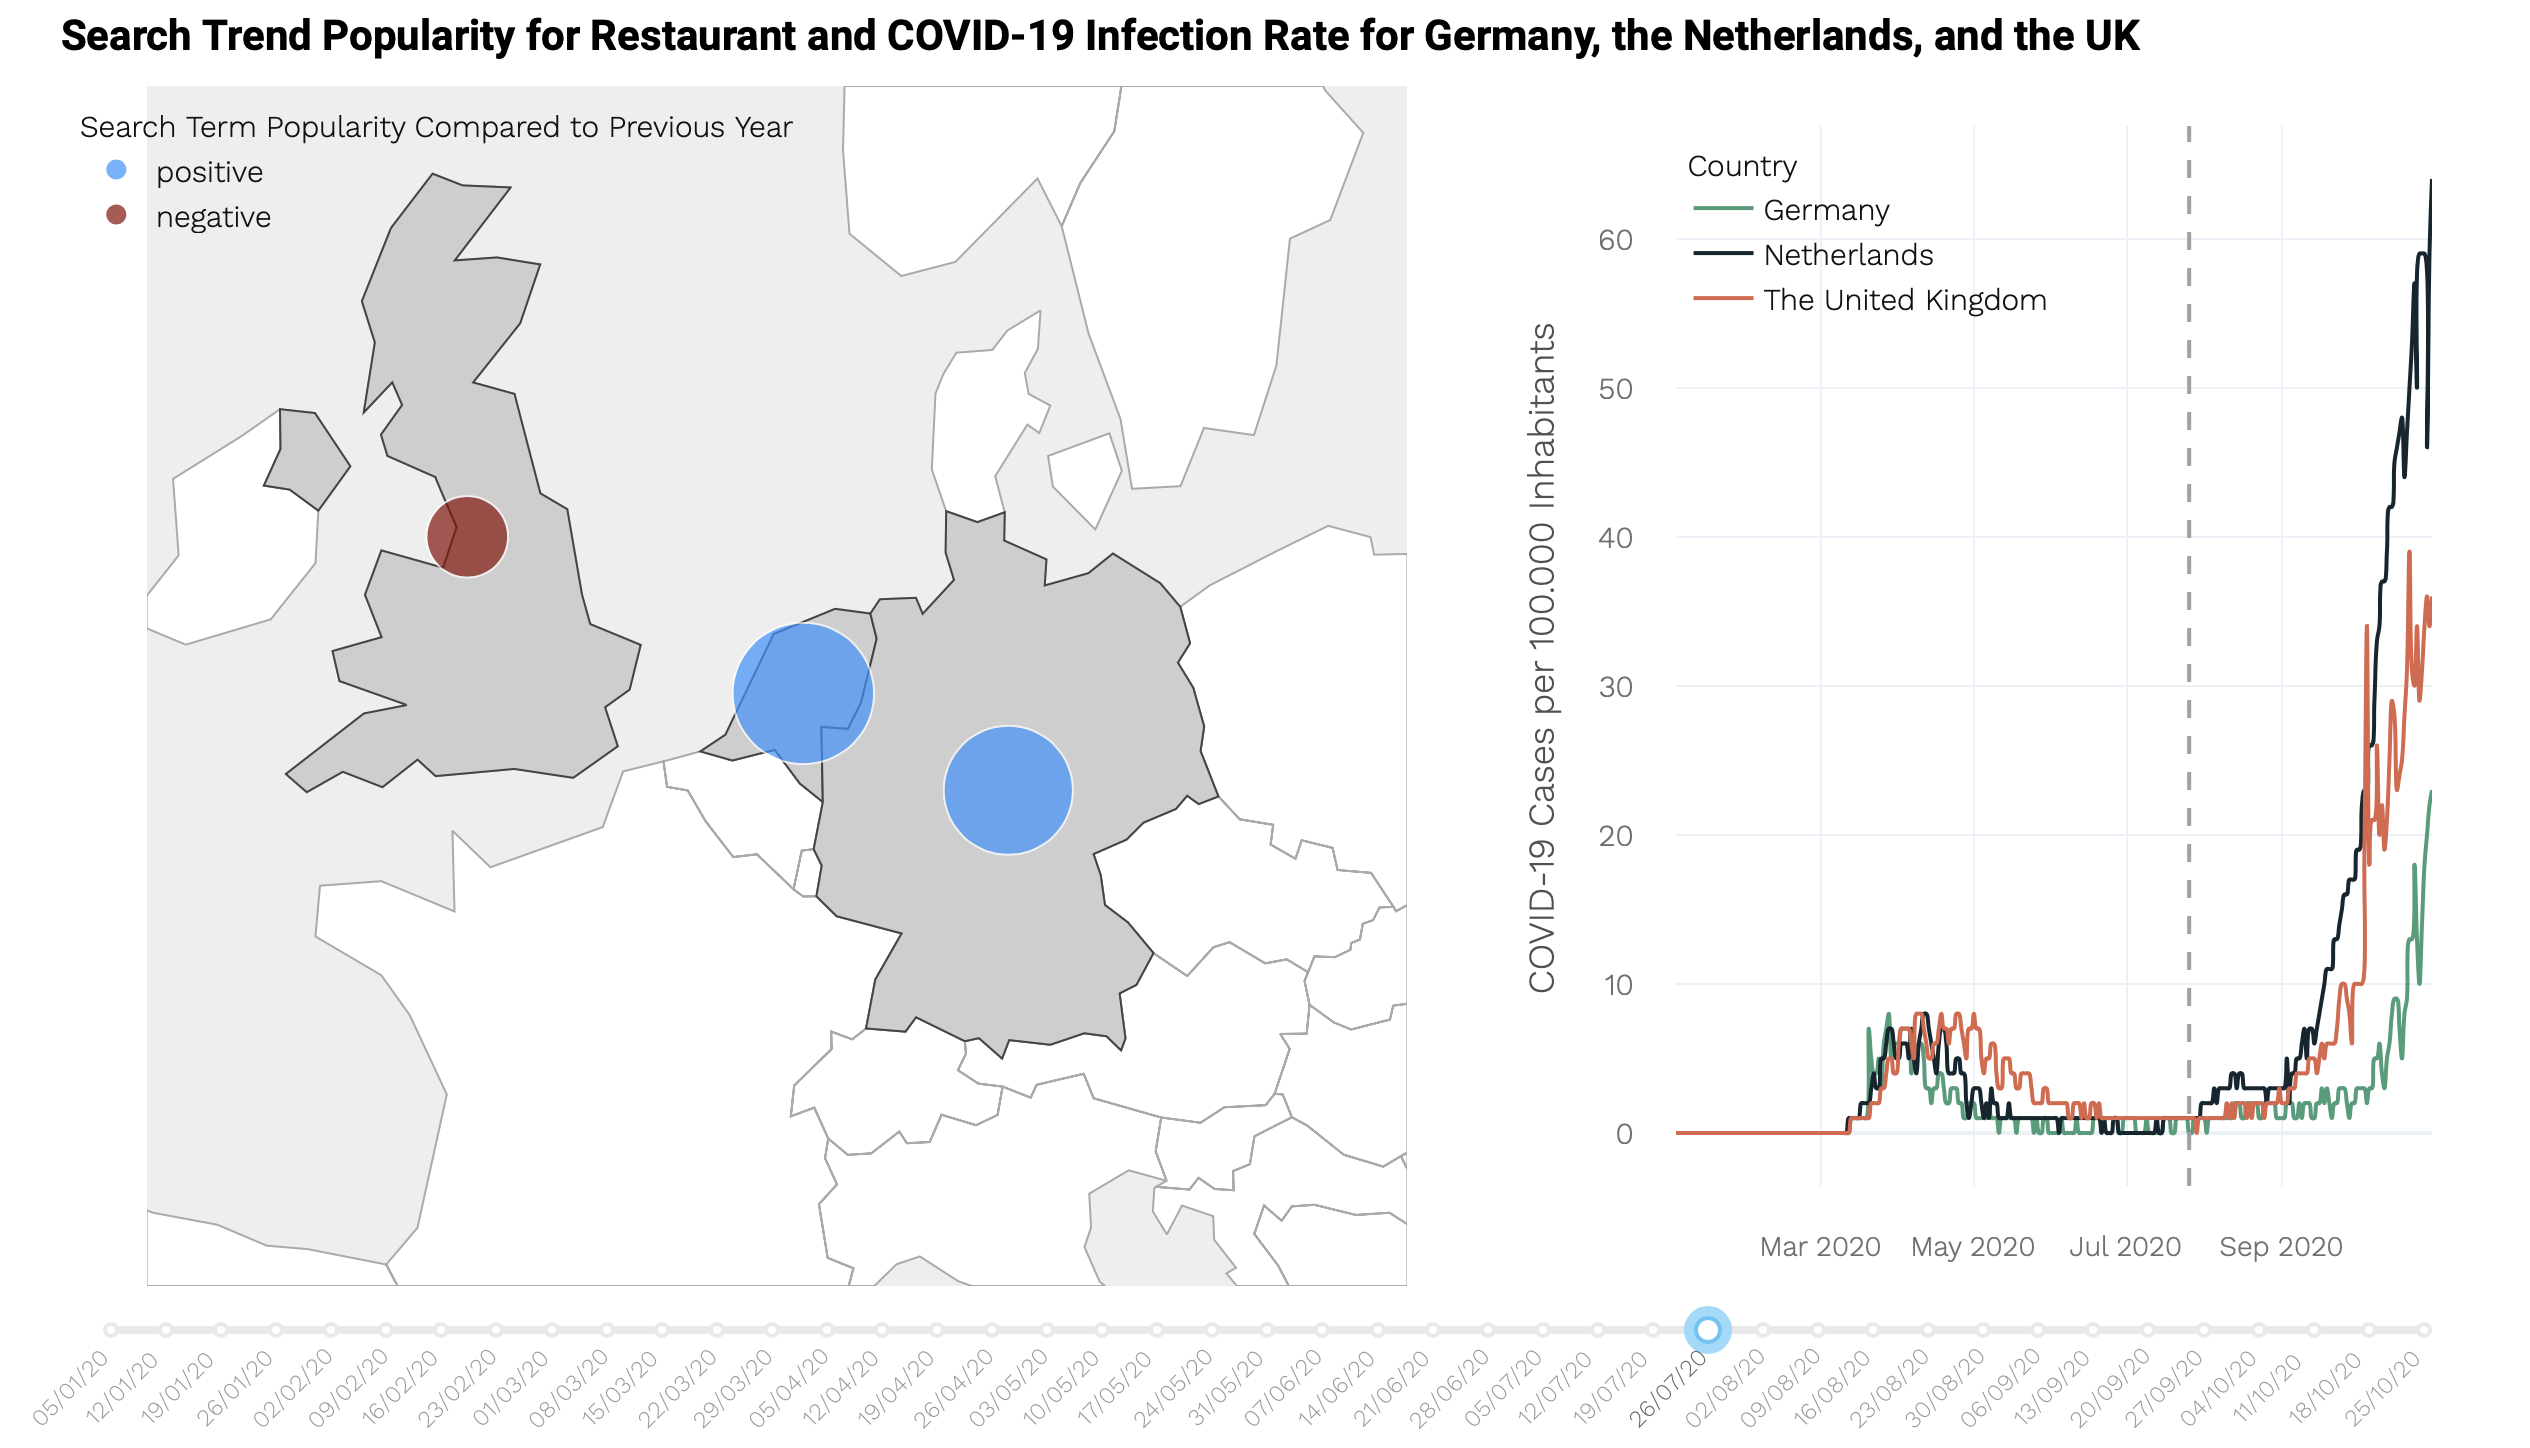
Close-up of the web application, showing the search trend popularity for the three countries and the daily COVID-19 cases.
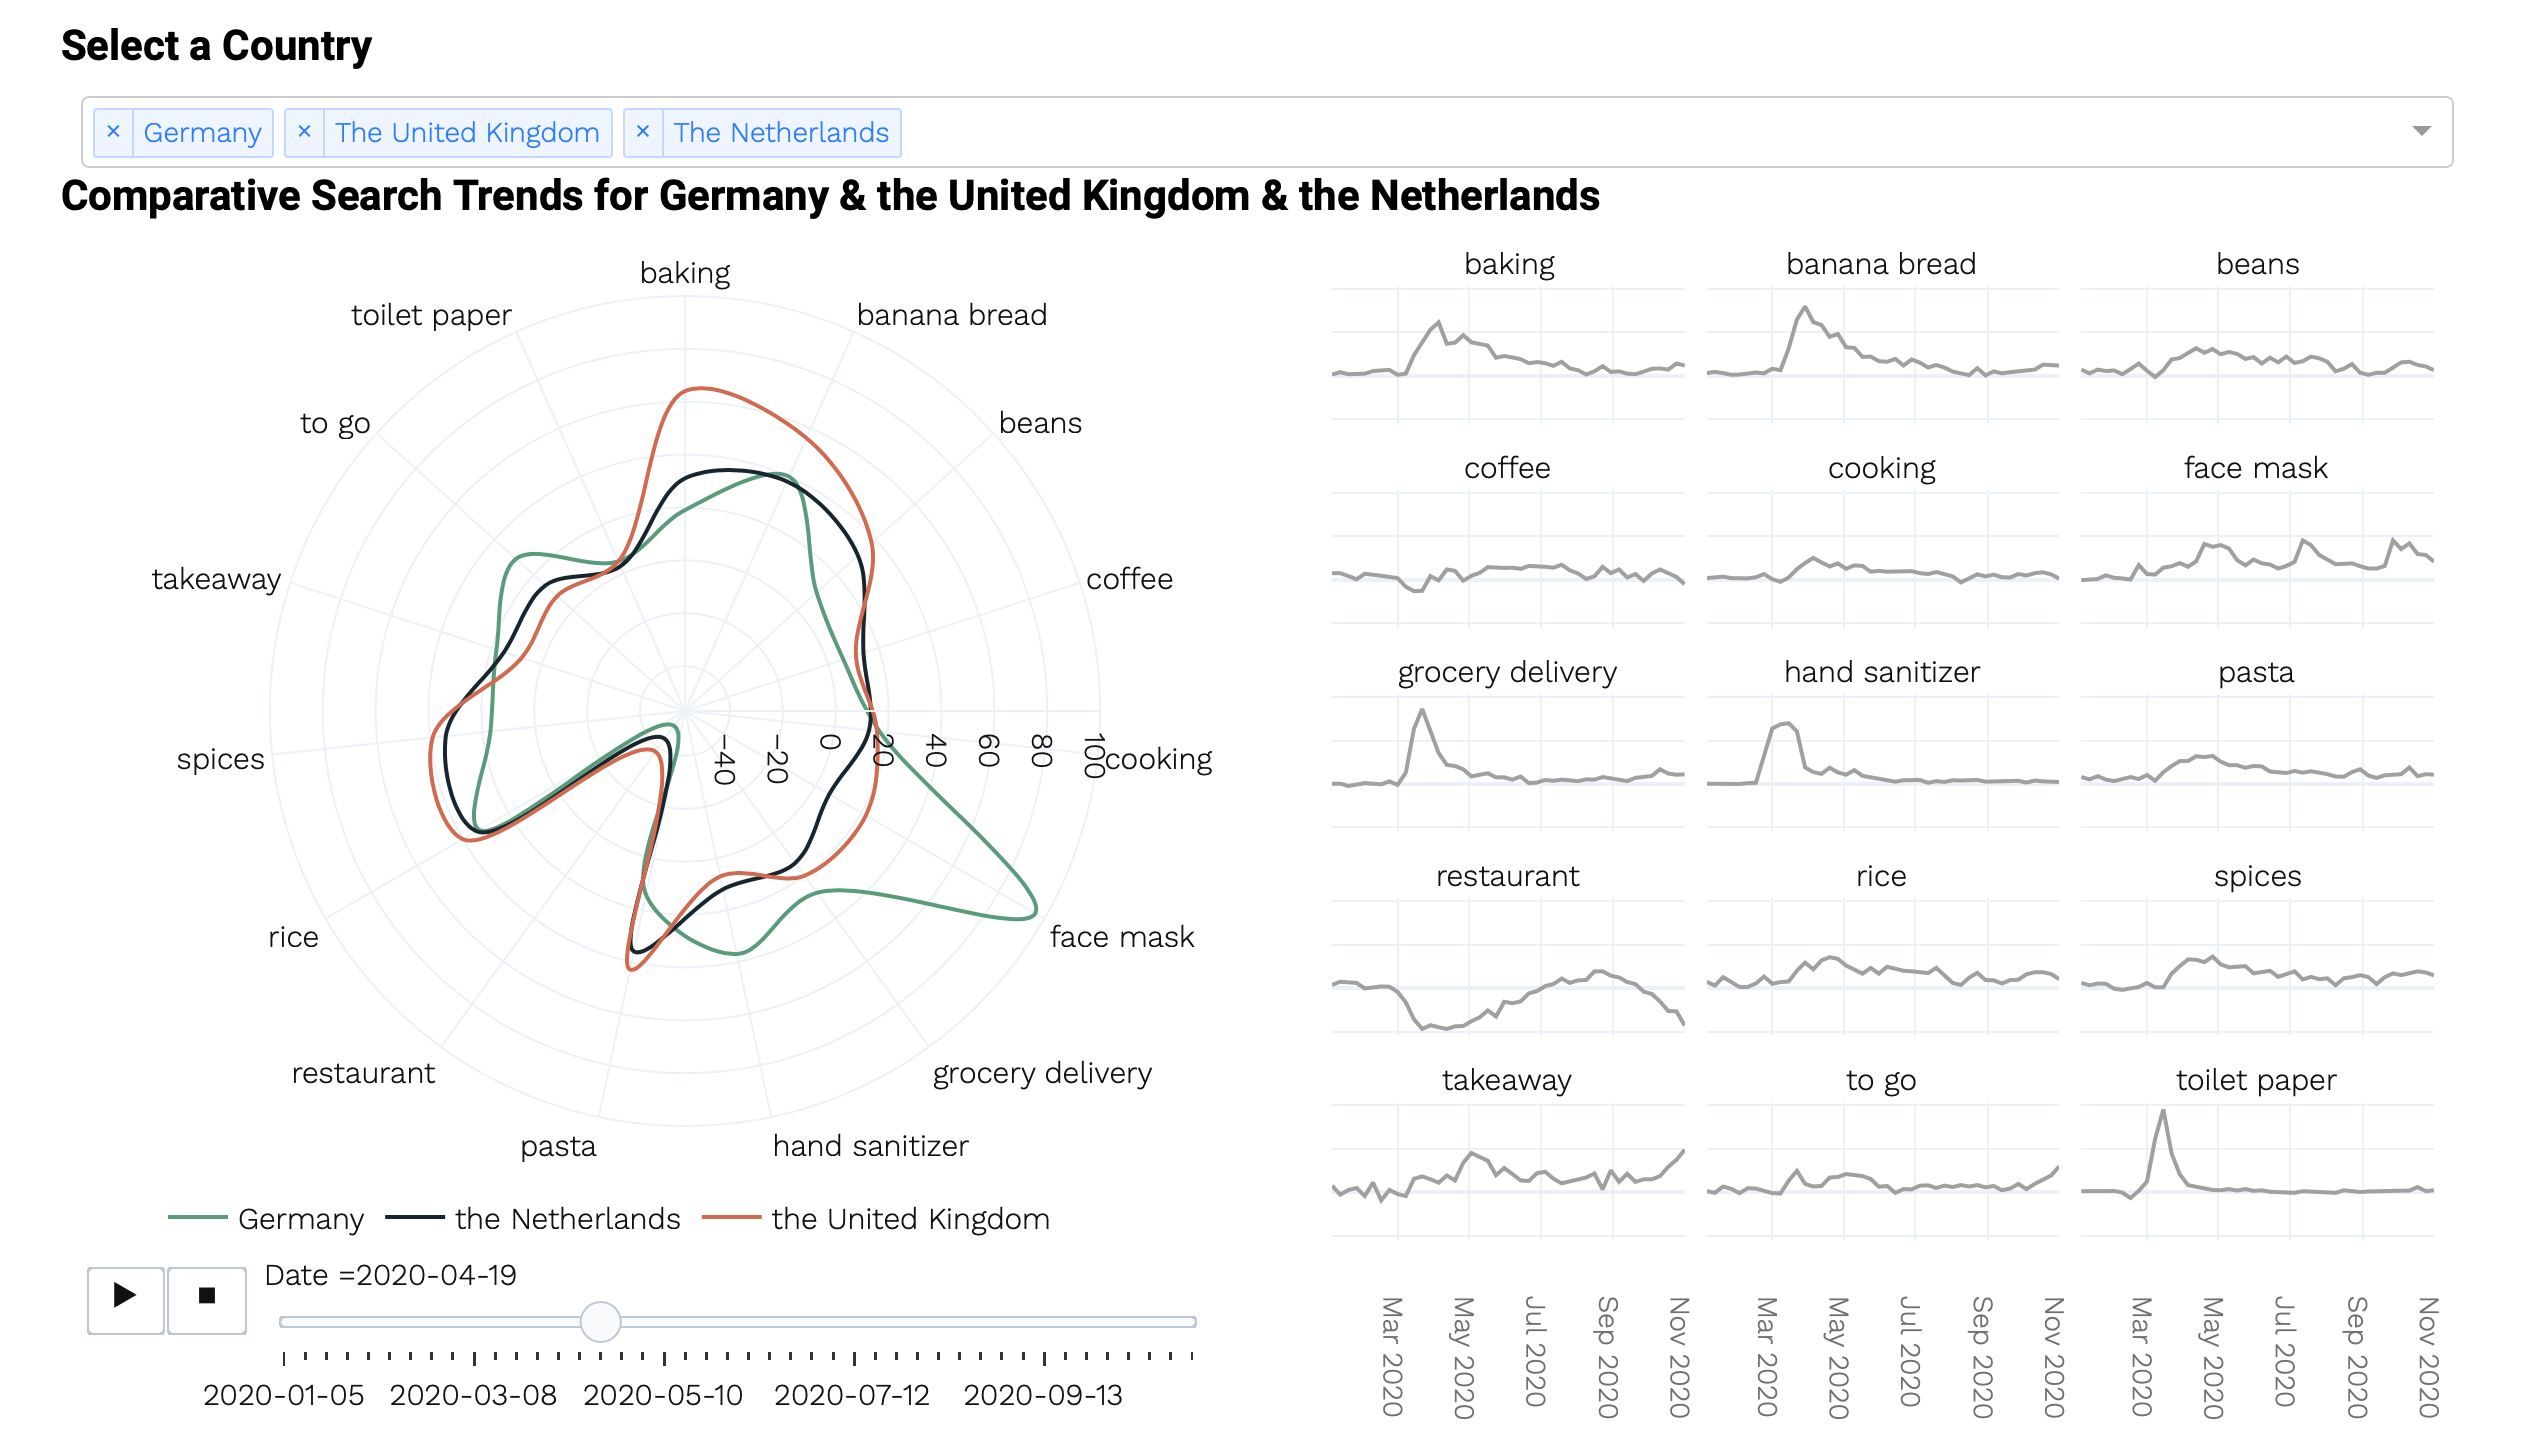
Close-up of the web application, showing the search trend popularity of all goods for the three countries.
Sources
[1] Google Trends (2020). Google Trends. Retrieved Nov 11, 2020, https://trends.google.com/trends/?geo=US
[2] World Health Organization (2020). WHO Coronavirus Disease (COVID-19) Dashboard. Retrieved Nov 11, 2020, from https://covid19.who.int/
[2] World Health Organization (2020). WHO Coronavirus Disease (COVID-19) Dashboard. Retrieved Nov 11, 2020, from https://covid19.who.int/
Students
Esmé Middaugh
Nele Peschel
Vivien van Dongen
Nele Peschel
Vivien van Dongen
10th intake
Supervisors
Juliane Cron, M.Sc.
Dr.-Ing. Mathias Jahnke
Dr.-Ing. Mathias Jahnke
Keywords
Google Trends, COVID-19, pandemic, web searches, search data, hoarding, pandemic behavior, World Health Organization (WHO)
Try it