Influences and Effects of COVID-19 Response
“This dashboard visualizes COVID-19 policies over time and space, allowing for comparison between case numbers, government measures and happiness.”
What it is about
This analysis set out to answer two main questions: which policies appear to have the largest influence on COVID-19 infection rates, and might the general happiness of countries before the pandemic have influenced their governmental responses to the pandemic? Due to the ongoing nature of the pandemic, no existing tools for investigating these relationships could be found. The results of this analysis were visualized in a dashboard.
How we built it
First, we compiled COVID-19 policy data from Oxford University¹, infection data from Our World In Data², and the World Happiness Report³. The correlation matrices for each country were constructed using Python to sort through our database and calculate correlation values for variables of interest. Our final dashboard was created using Tableau to visualize our results.
Challenges we ran into
As we were working with three different databases, it was challenging to unify and join them, so that we could easily compare, extract and analyse information from each of them.
What we're proud of
With this dashboard, we have created the first visualization of COVID-19 policies to date. Our platform can serve as a starting point for policy makers to understand which policies are most effective at keeping COVID at bay.
What we learned
The pandemic is so multi-faceted that generalizing about it on a global scale is nearly impossible. No matter how many variables we include in our analysis, there will always be more factors that affect the spread of COVID-19.
What's next
This dashboard could be improved through the addition of continuously up-to-date COVID-19 case statistics, as well as the implementation of responsive-view features for mobile devices.
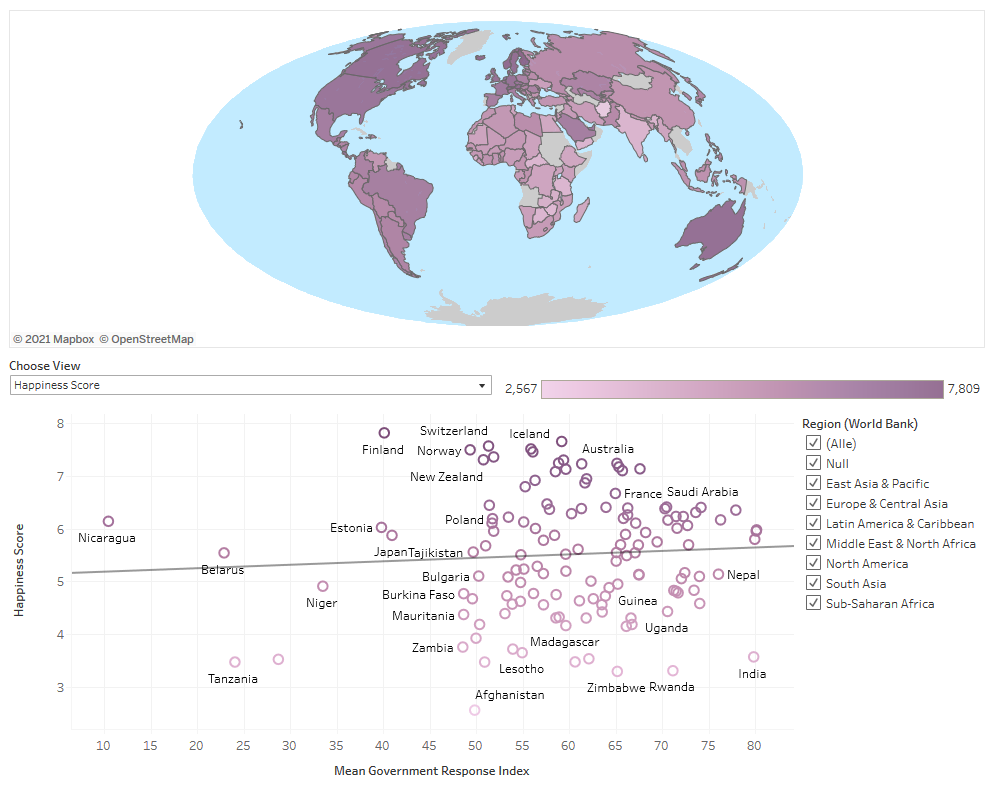
Map representing global overall happiness score (above) and a plot of those happiness scores against each country’s Government Response Index.
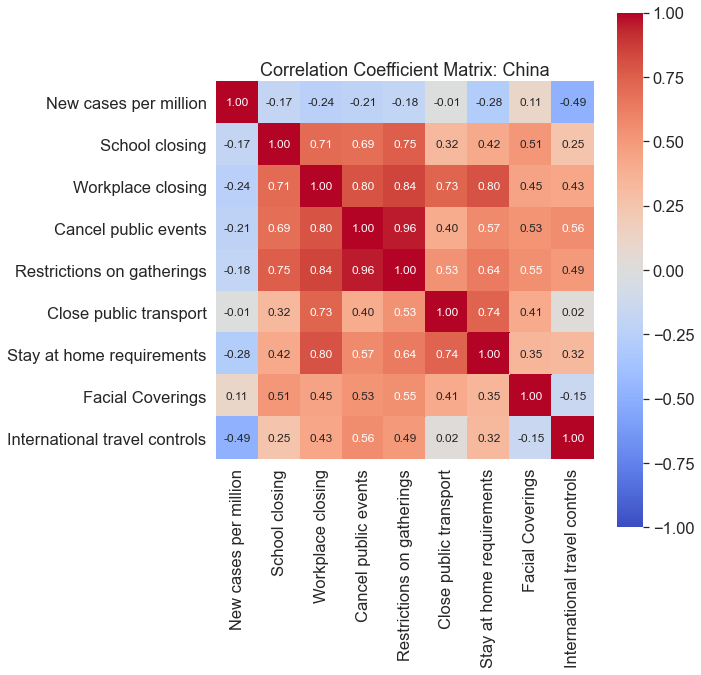
China’s correlation matrix showing policies and corresponding fluctuations in case numbers.
Our team working in our natural habitat (Zoom!).
Sources
[1] Hale, Thomas, Sam Webster, Anna Petherick, Toby Phillips, and Beatriz Kira (2020). Oxford COVID-19 Government Response Tracker, Blavatnik School of Government. Data use policy: Creative Commons Attribution CC BY standard. https://covidtracker.bsg.ox.ac.uk/
[2] Hasell, J., Mathieu, E., Beltekian, D. et al. (2020). A cross-country database of COVID-19 testing. Sci Data 7, 345. Data use policy: Creative Commons Attribution CC BY standard. https://doi.org/10.1038/s41597-020-00688-8
[3] Helliwell, John F., Richard Layard, Jeffrey Sachs, and Jan-Emmanuel De Neve (2020). World Happiness Report 2020. New York: Sustainable Development Solutions Network. https://worldhappiness.report/ed/2020/
Students
Samantha Levi
Camilo Cardona
Valerian Lange
Camilo Cardona
Valerian Lange
10th intake
Supervisors
Juliane Cron, M.Sc.
Dr.-Ing. Mathias Jahnke
Dr.-Ing. Mathias Jahnke
Keywords
COVID-19, Government Policy, Happiness
Try it